. 2022 Sep 7;110(17):2771-2789.e7.
doi: 10.1016/j.neuron.2022.06.018. Epub 2022 Jul 22.

Neuroscience Cloud Analysis As a Service: An open-source platform for scalable, reproducible data analysis

Affiliations

Neuroscience Cloud Analysis As a Service: An open-source platform for scalable, reproducible data analysis

Taiga Abe et al. Neuron. .

Abstract

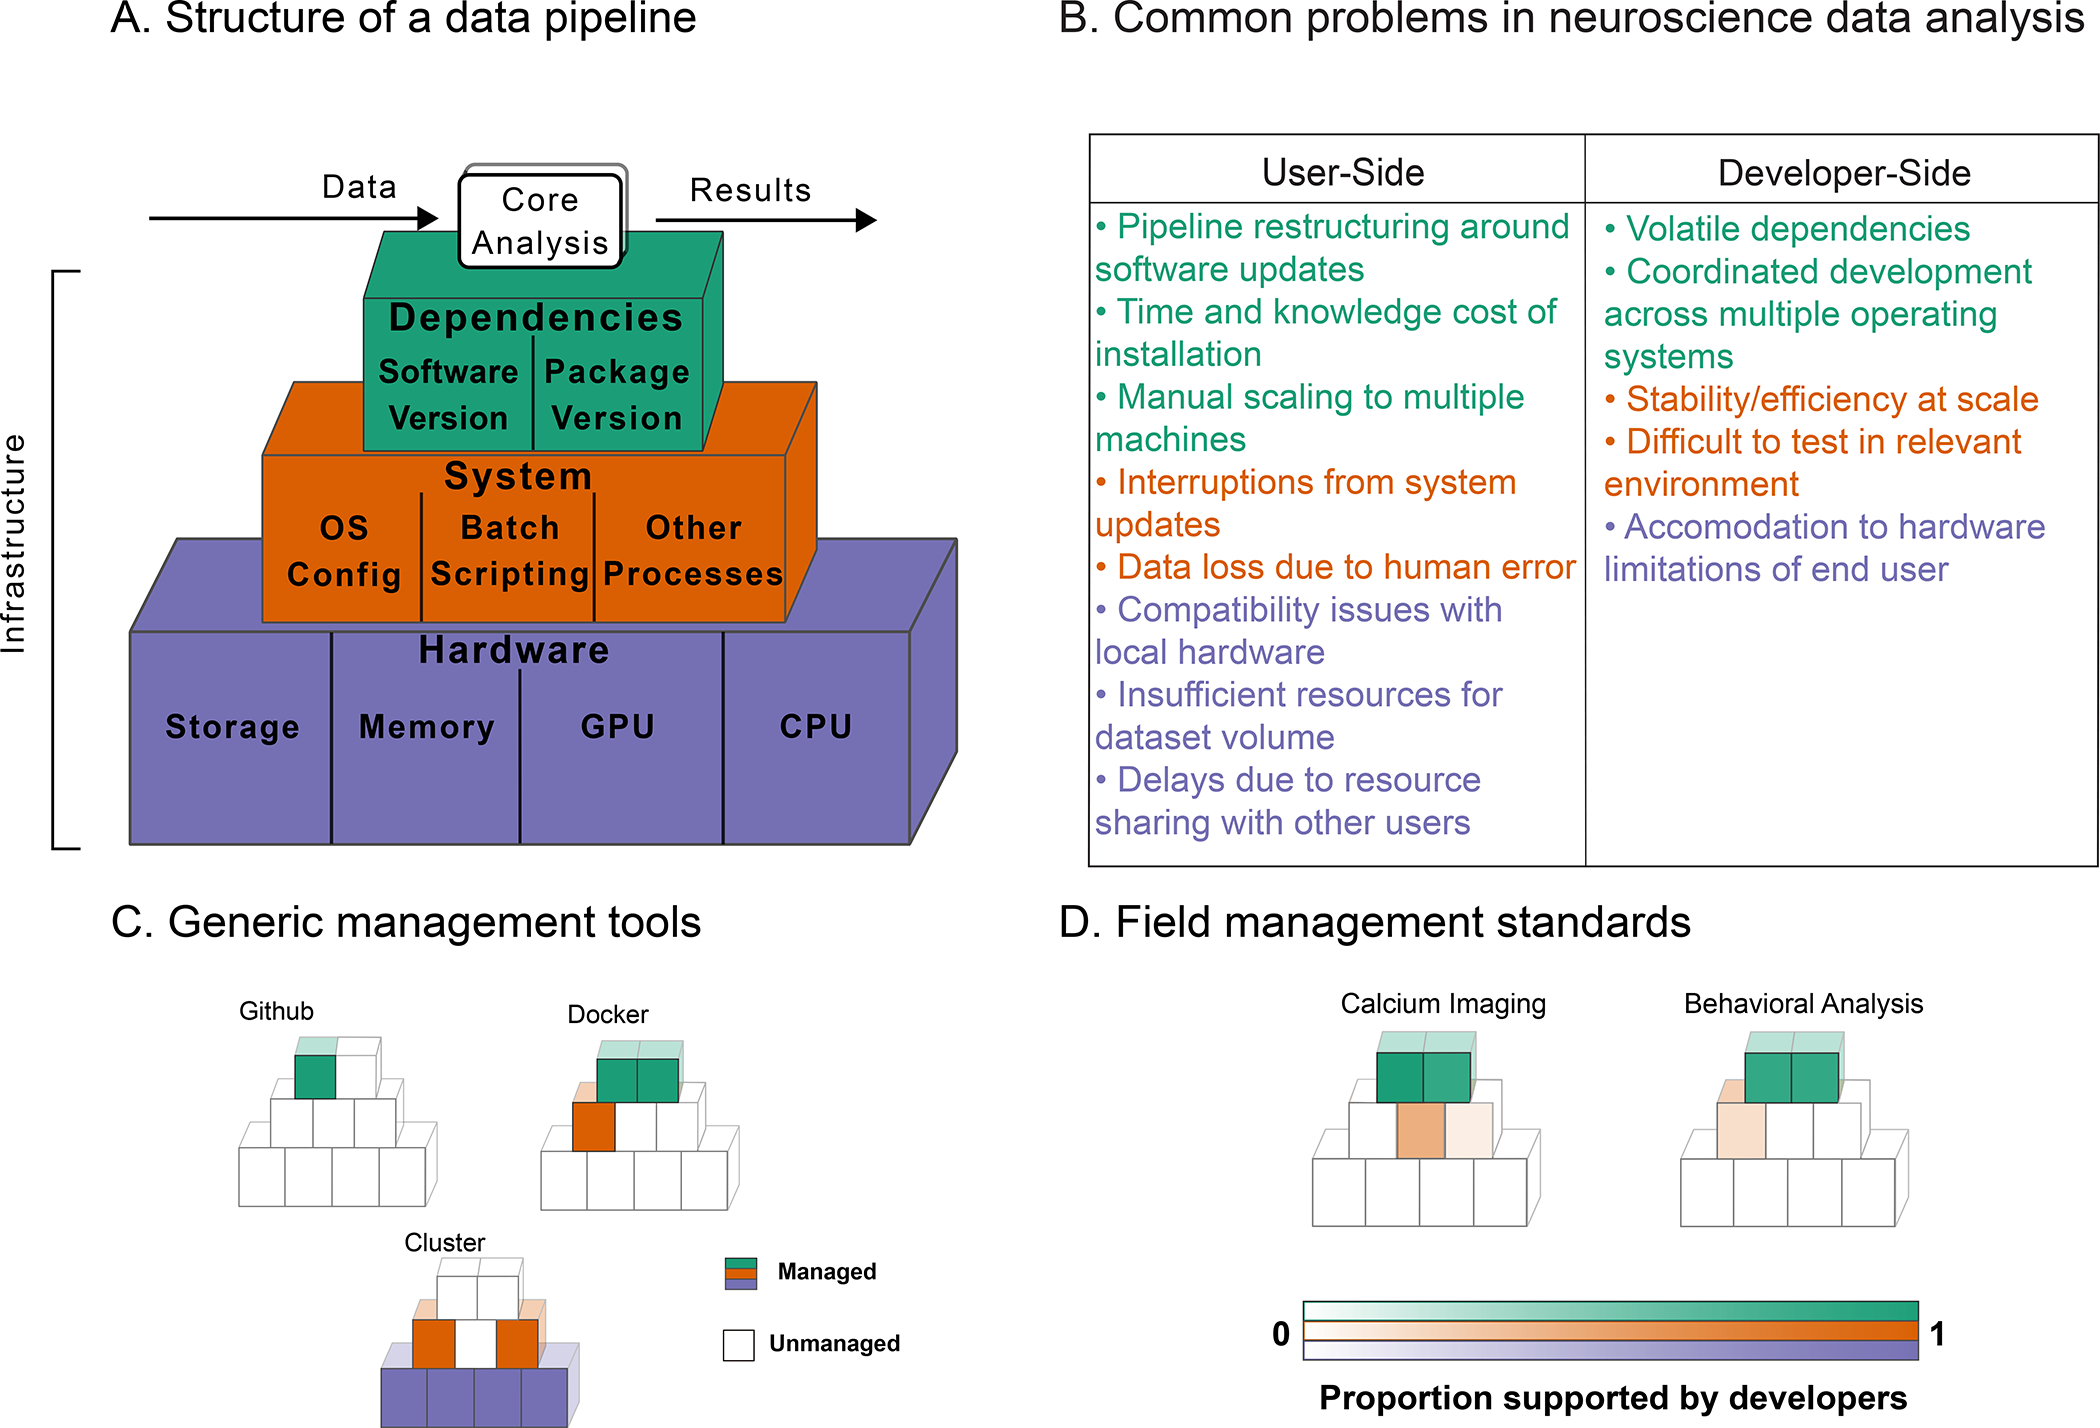
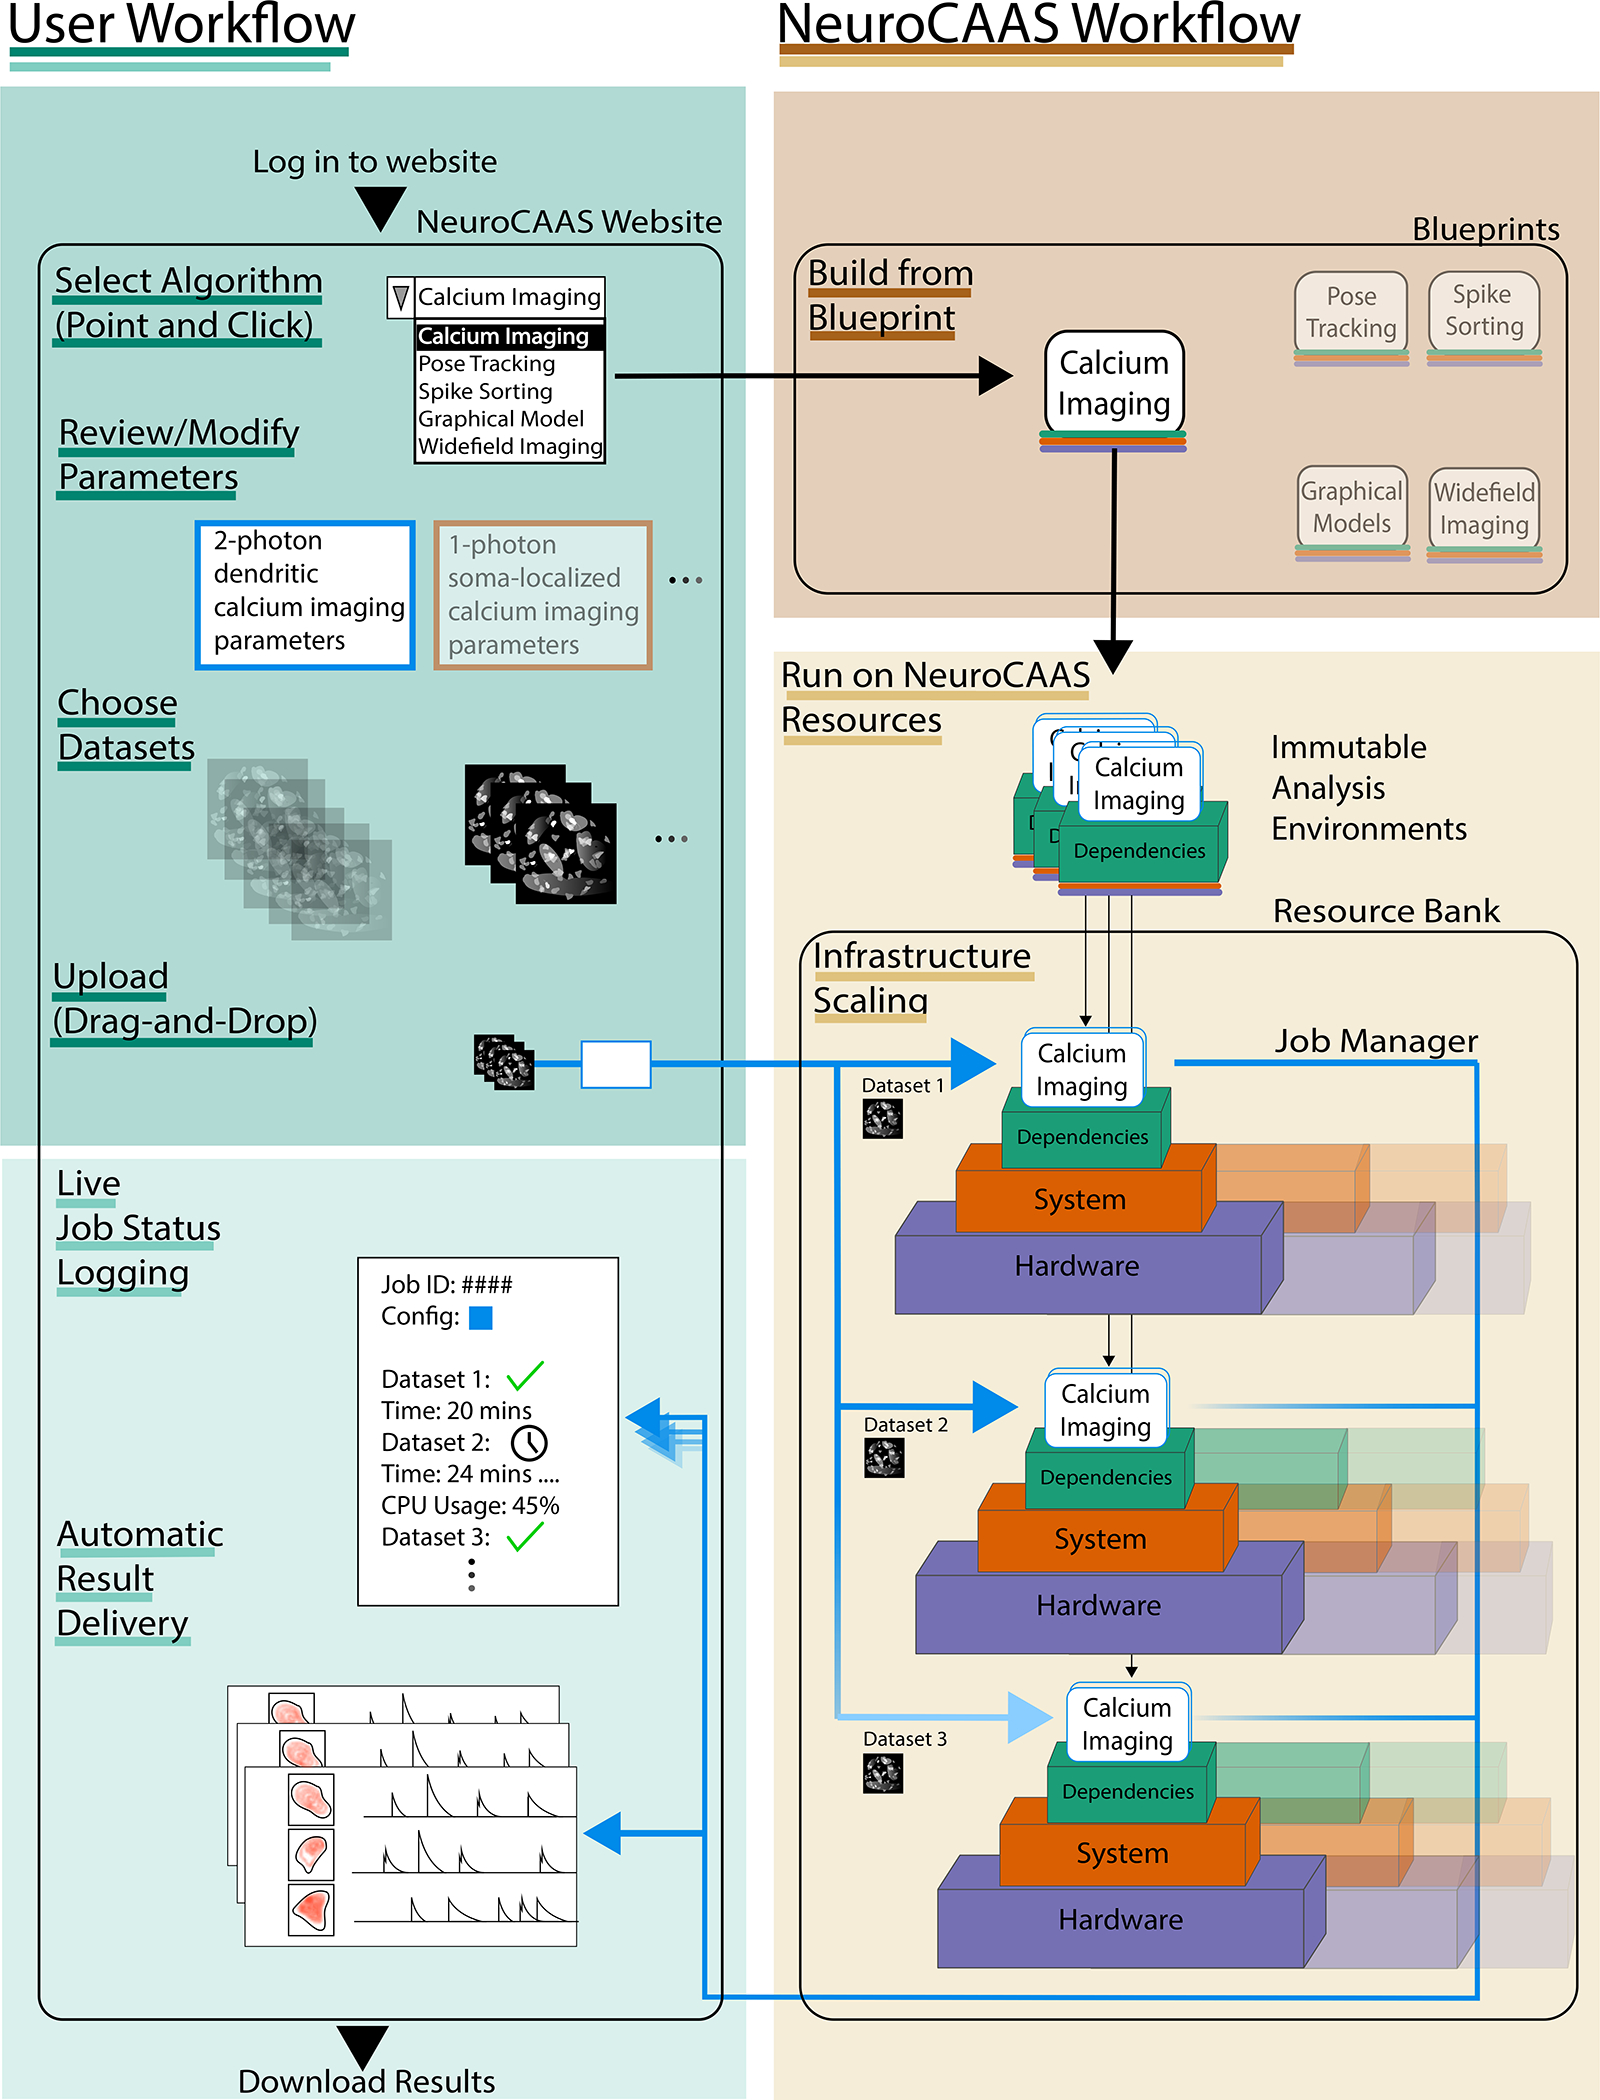
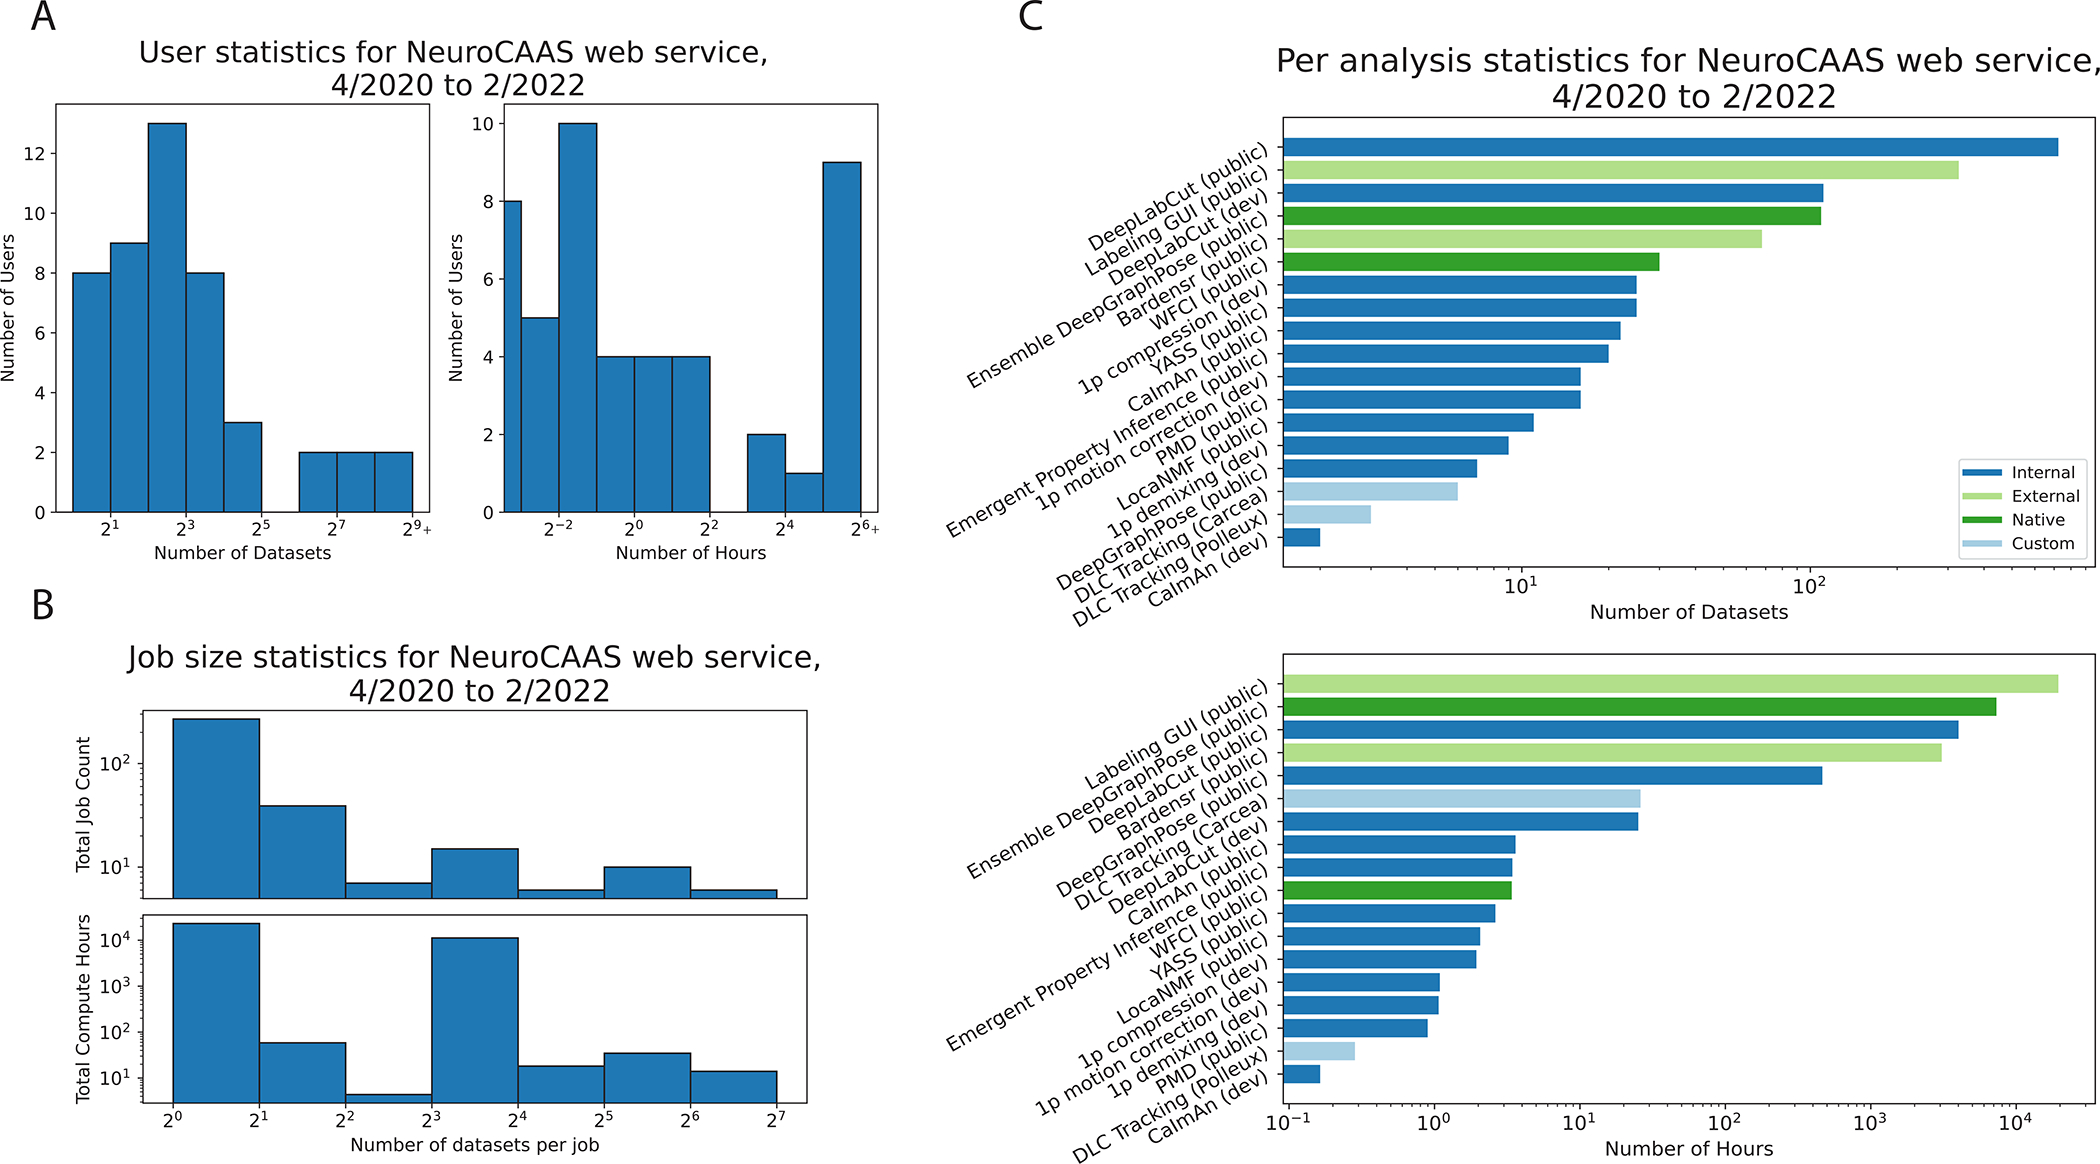
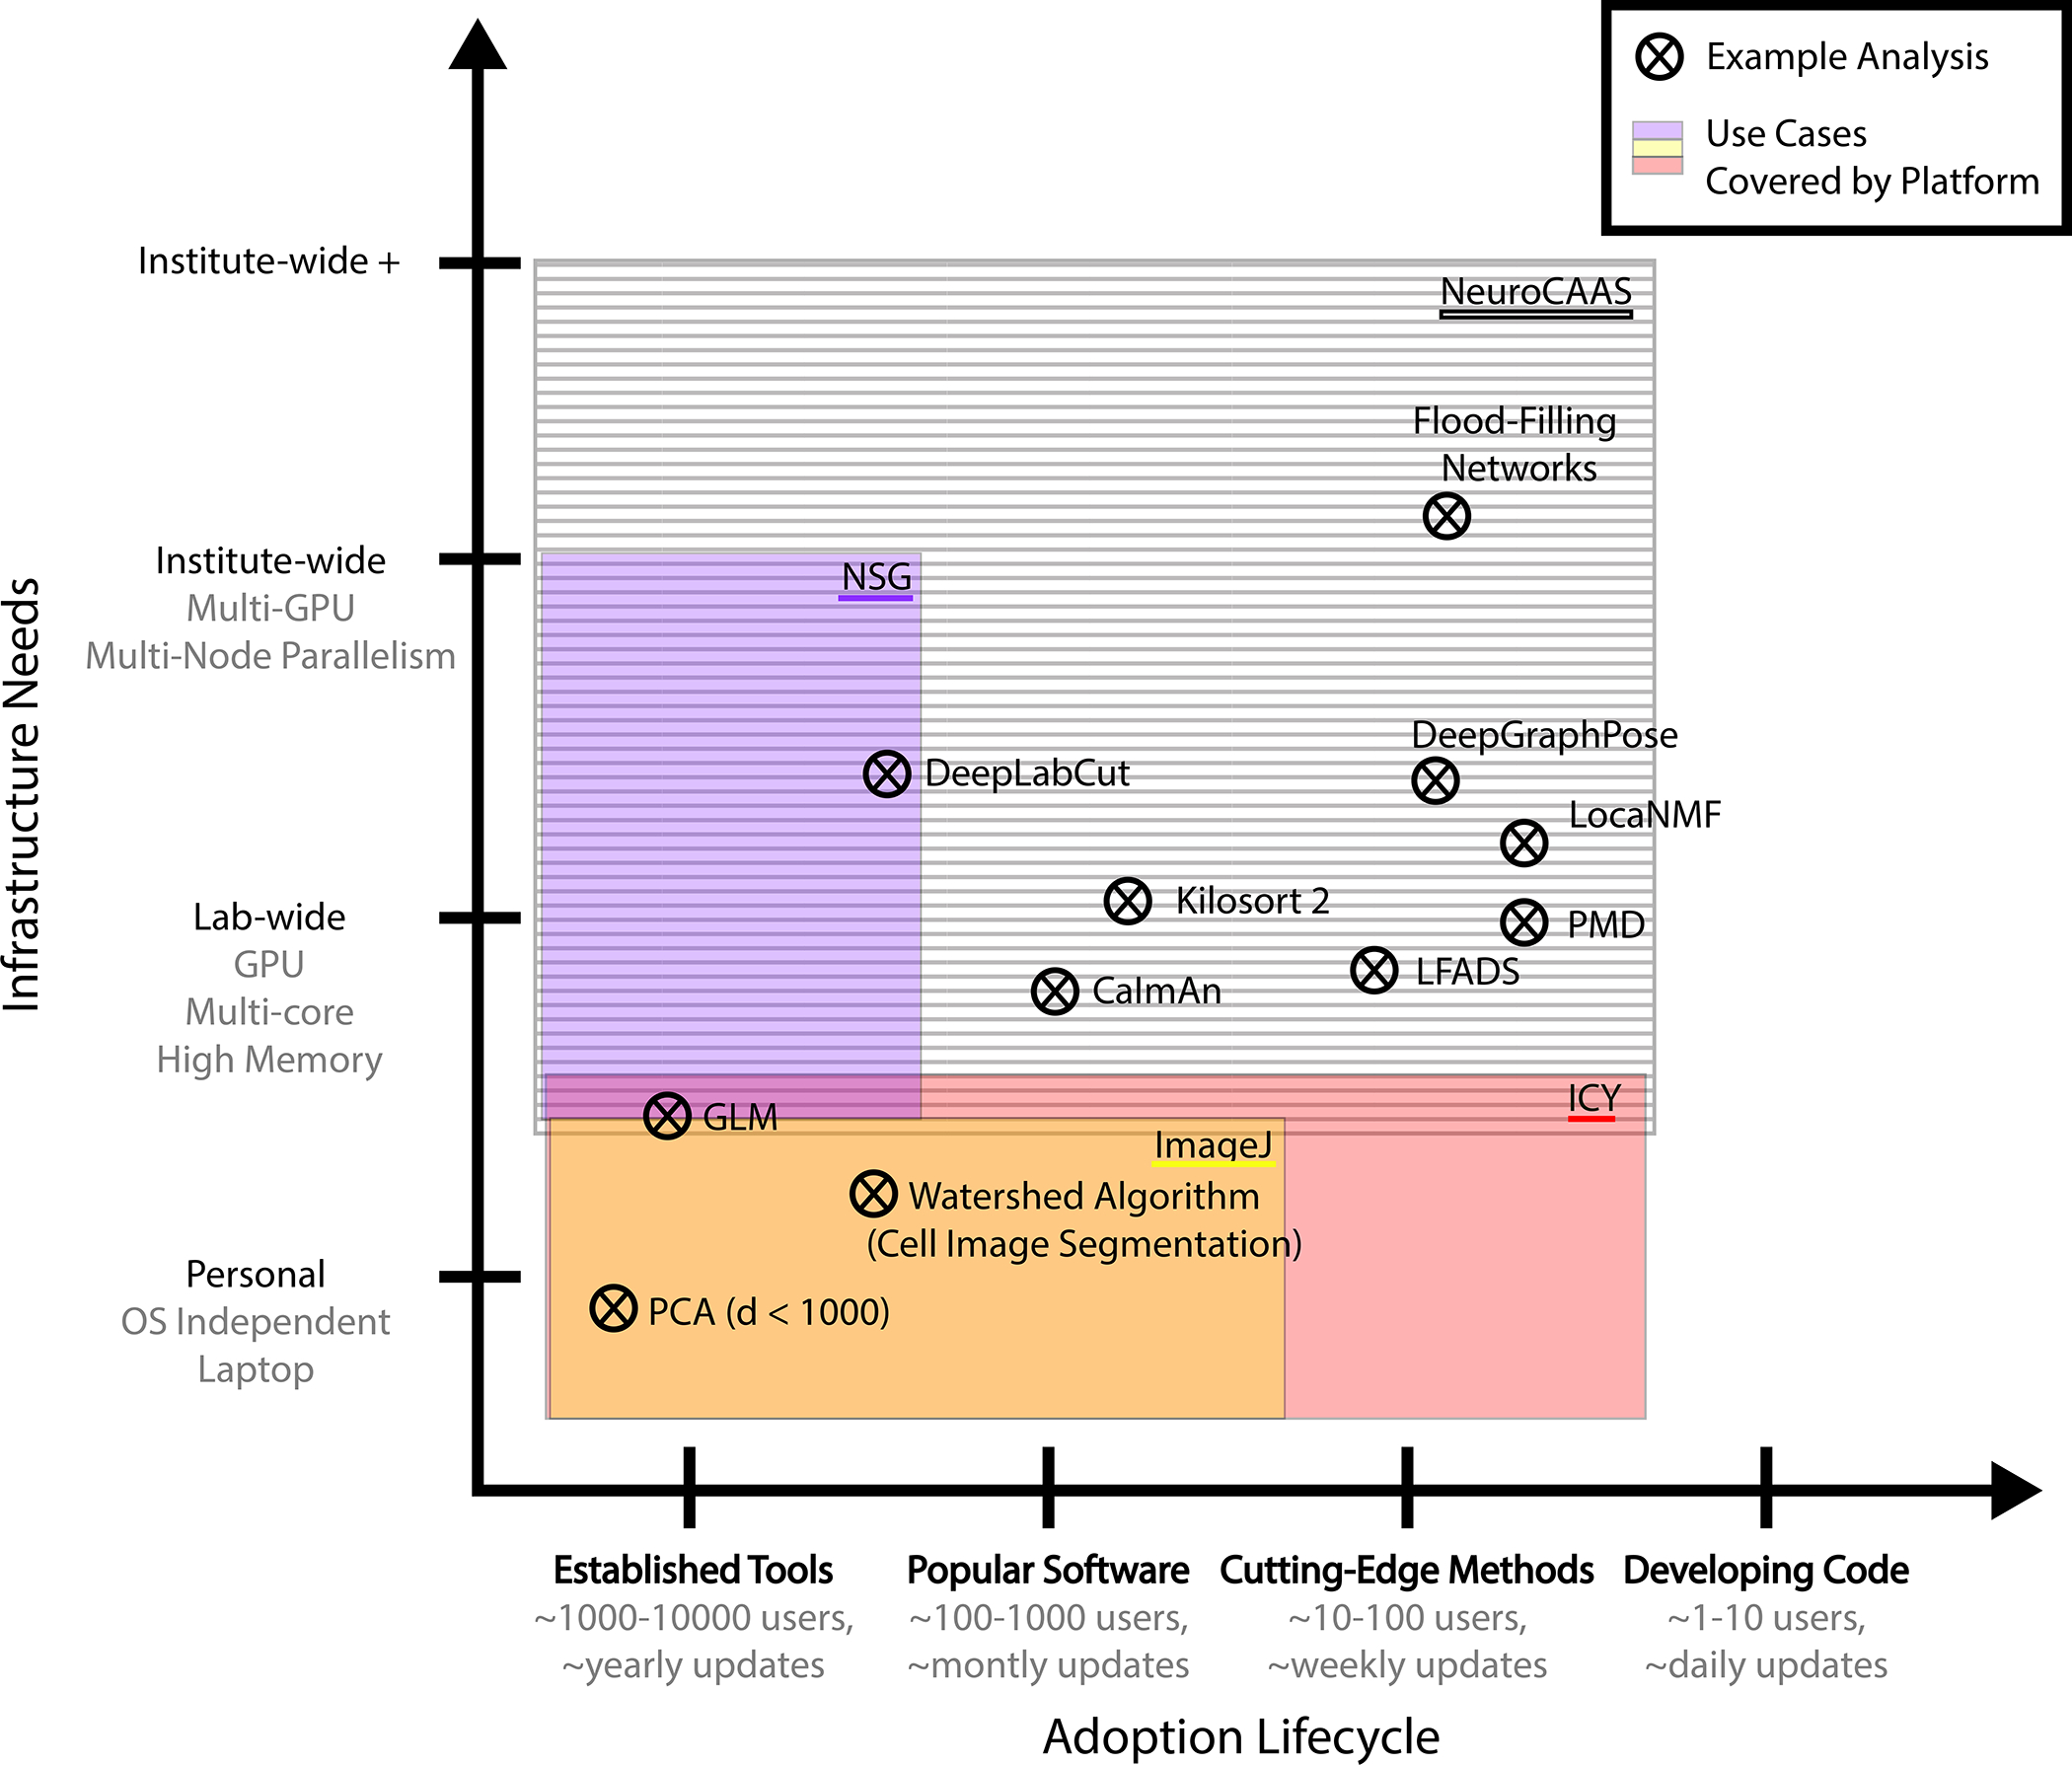
A key aspect of neuroscience research is the development of powerful, general-purpose data analyses that process large datasets. Unfortunately, modern data analyses have a hidden dependence upon complex computing infrastructure (e.g., software and hardware), which acts as an unaddressed deterrent to analysis users. Although existing analyses are increasingly shared as open-source software, the infrastructure and knowledge needed to deploy these analyses efficiently still pose significant barriers to use. In this work, we develop Neuroscience Cloud Analysis As a Service (NeuroCAAS): a fully automated open-source analysis platform offering automatic infrastructure reproducibility for any data analysis. We show how NeuroCAAS supports the design of simpler, more powerful data analyses and that many popular data analysis tools offered through NeuroCAAS outperform counterparts on typical infrastructure. Pairing rigorous infrastructure management with cloud resources, NeuroCAAS dramatically accelerates the dissemination and use of new data analyses for neuroscientific discovery.

Keywords: cloud compute; data analysis; ensembling; infrastructure-as-code; markerless tracking; open source; widefield calcium imaging.


Conflict of interest statement

Declaration of interests The authors declare no competing interests.

Figures

Figure 1:
Figure 1:. Data Analysis Infrastucture.
A. Core analysis code depends upon an infrastructure stack. B. Common problems arise at each layer of this infrastructure stack for analysis users and developers. C. Many common management tools deal only with one or two layers in the infrastructure stack, leaving gaps that users and developers must fill manually. D. In common neural data analysis tools for calcium imaging and behavioral analysis many infrastructure components are not managed by analysis developers and implicitly delegated to the user (see §9 for full details and supporting data in Tables S2,S1).
Figure 2:
Figure 2:. Overview of NeuroCAAS User Workflow.
Left indicates the user’s experience; right indicates the work that NeuroCAAS performs. The user chooses from the analyses encoded in NeuroCAAS. They then modify corresponding configuration parameters as needed. Finally, the user uploads dataset(s) and a configuration file for analysis. NeuroCAAS detects upload event and deploys the requested analysis using an infrastructure blueprint (§2.1.4). NeuroCAAS builds the appropriate number of IAEs (§2.1.1) and corresponding hardware instances (§2.1.3). Multiple infrastructure stacks may be deployed in parallel for multiple datasets and the job manager (§2.1.2) automatically handles input and output scaling. The deployed resources persist only as necessary, and results, as well as diagnostic information, are automatically routed back to the user. See Figure S1 for comparison with IaGS, and Figure S3 for IAE list.
Figure 3:
Figure 3:. Usage statistics NeuroCAAS Platform.
Usage data over a 22-month alpha test period. A. Histogram for number of datasets (left) and corresponding compute hours (right) spent by each active user of NeuroCAAS. B. Histograms for job size indicates the number of datasets (top) and corresponding compute hours (bottom) concurrently analyzed in jobs. C. Usage grouped by platform developer. Dark blue: analyses adapted for NeuroCAAS by paper authors. Light green: analyses that were not developed by NeuroCAAS authors. Dark green: NeuroCAAS native analyses (§2.4, 2.5). Light blue: custom versions of generic analyses built for individual alpha users. We exclude usage attributed to NeuroCAAS team members.
Figure 4:
Figure 4:. Landscape of Cellular/Circuit-Level Neuroscience Analysis Platforms.
Crosses: popular analyses in terms of their place in the adoption lifecycle (number of users, rate of software updates), and their infrastructure needs. Coloring: representative platforms, indicating the parts of analysis space that are covered by a given platform. (Example analyses: (Goodman and Brette, 2009; Pnevmatikakis et al., 2016; Mathis et al., 2018; Pachitariu et al., 2016; Pandarinath et al., 2018; Januszewski et al., 2018; Saxena et al., 2020; Buchanan et al., 2018; Graving et al., 2019); Representative platforms: (Sanielevici et al., 2018; Chaumont et al., 2012; Schneider et al., 2012).
Figure 5:
Figure 5:
NeuroCAAS Supports Multi-Stack Design Patterns. A. Default workflow: If more than one dataset is submitted, NeuroCAAS automatically creates separate infrastructure for each. B. Chained workflow: Multiple analysis components with different infrastructure needs are seamlessly combined on demand. Intermediate results are returned to the user so that they can be examined and visualized as well (§2.4). C. Parallelism + chained workflow: Workflows A and B can also be combined to support batch processing pipelines with a separate postprocessing step (§2.5).
Figure 6:
Figure 6:. Ensemble Markerless Tracking.
A. Example frame from mouse behavior dataset (courtesy of Erica Rodriguez and C. Daniel Salzman) tracking keypoints on the top down view of a mouse, as analyzed in Wu et al. (2020). Marker shapes track different body parts: blue markers representing the output of individual tracking models, and orange markers representing the consensus. Inset image shows tracking performance on the nose and ears of the mouse. B. consensus test performance vs. test performance of individual networks on a dataset with ground truth labels as measured via root mean squared error (RMSE). C. traces from 9 networks (blue) + consensus (orange). Across the entire figure, ensemble size = 9. A and C correspond to traces taken from the 100% split in B corresponding to 20 training frames.
Figure 7:
Figure 7:. Quantitative Comparison of NeuroCAAS vs. Local Processing for Three Different Analyses
A. Simple quantifications of NeuroCAAS performance. Left graphs compare total processing time on NeuroCAAS vs. local infrastructure (orange). NeuroCAAS processing time is broken into two parts: Upload (yellow) and Compute (green). Right graphs quantify cost of analyzing data on NeuroCAAS with two different pricing schemes: Standard (dark blue) or Save (light blue). B. Cost comparison with local infrastructure (LCC). Figure compares local pricing against both Standard and Save prices, with Realistic (2 year) and Optimistic (4 year) lifecycle times for local hardware. C. Achieving Crossover Analysis Rates. Local Utilization Crossover gives the minimum utilization required to achieve crossover rates shown in B. Dashed vertical line indicates maximum feasible utilization rate at 100% (utilizing local infrastructure 24 hours, every day). See Figure S7 for cluster analysis, and Tables S4–S8 for supporting data.

Comment in

References

    1. Abadi M, Barham P, Chen J, Chen Z, Davis A, Dean J, Devin M, Ghemawat S, Irving G, Isard M et al. (2016), Tensorflow: A system for large-scale machine learning, in ‘12th Symposium on Operating Systems Design and Implementation (OSDI 16)’, pp. 265–283.
    1. Aguiar A, Díaz J, Almaraz R, Pérez J and Garbajosa J (2018), DevOps in Practice – An Exploratory Case Study, in ‘Proceedings of the 19th International Conference on Agile Software Development: Companion, XP ‘18’, pp. 1–3.
    1. Amezquita RA, Lun AT, Becht E, Carey VJ, Carpp LN, Geistlinger L, Marini F, Rue-Albrecht K, Risso D, Soneson C et al. (2020), ‘Orchestrating single-cell analysis with bioconductor’, Nature methods 17(2), 137–145. - PMC - PubMed
    1. Amstutz P, Crusoe MR, Tijanic N. s., Chapman B, Chilton J, Heuer M, Kartashov A, Kern J, Leehr D, Menager H, Nedeljkovich M, Scales M, Soiland-Reyes S and Stojanovic L (2016), ‘Common Workflow Language, v1.0’. 10.6084/m9.figshare.3115156.v2 - DOI
    1. Avesani P, McPherson B, Hayashi S, Caiafa CF, Henschel R, Garyfallidis E, Kitchell L, Bullock D, Patterson A, Olivetti E et al. (2019), ‘The open diffusion data derivatives, brain data upcycling via integrated publishing of derivatives and reproducible open cloud services’, Scientific data 6(1), 1–13. - PMC - PubMed

Publication types