

The M3 Muscarinic Acetylcholine Receptor Promotes Epidermal Differentiation
- PMID: 35870560
- PMCID: PMC9851810
- DOI: 10.1016/j.jid.2022.06.013
The M3 Muscarinic Acetylcholine Receptor Promotes Epidermal Differentiation
Abstract
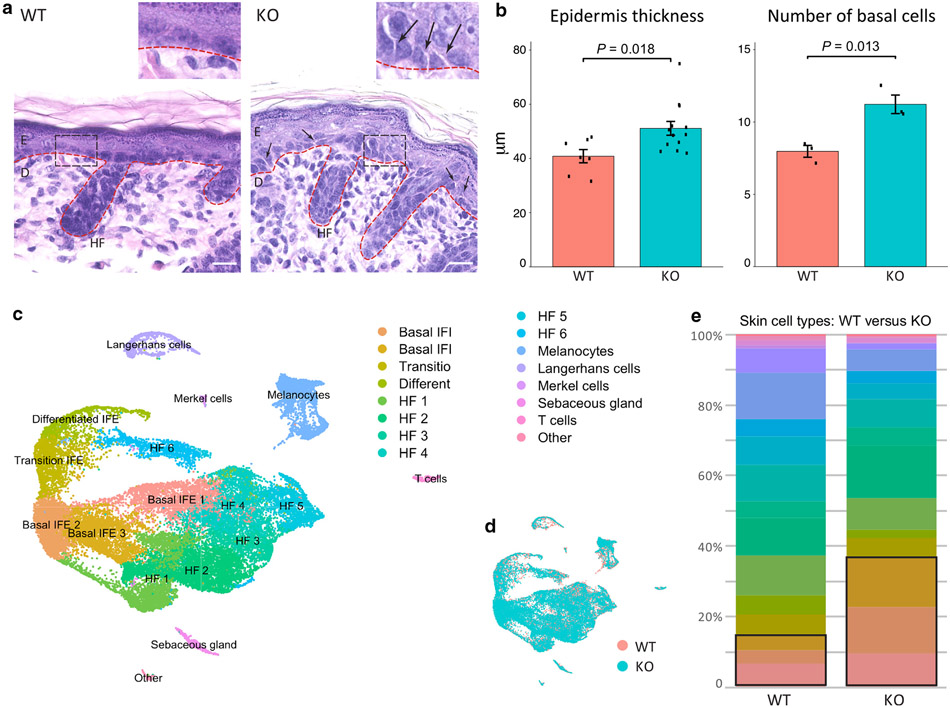
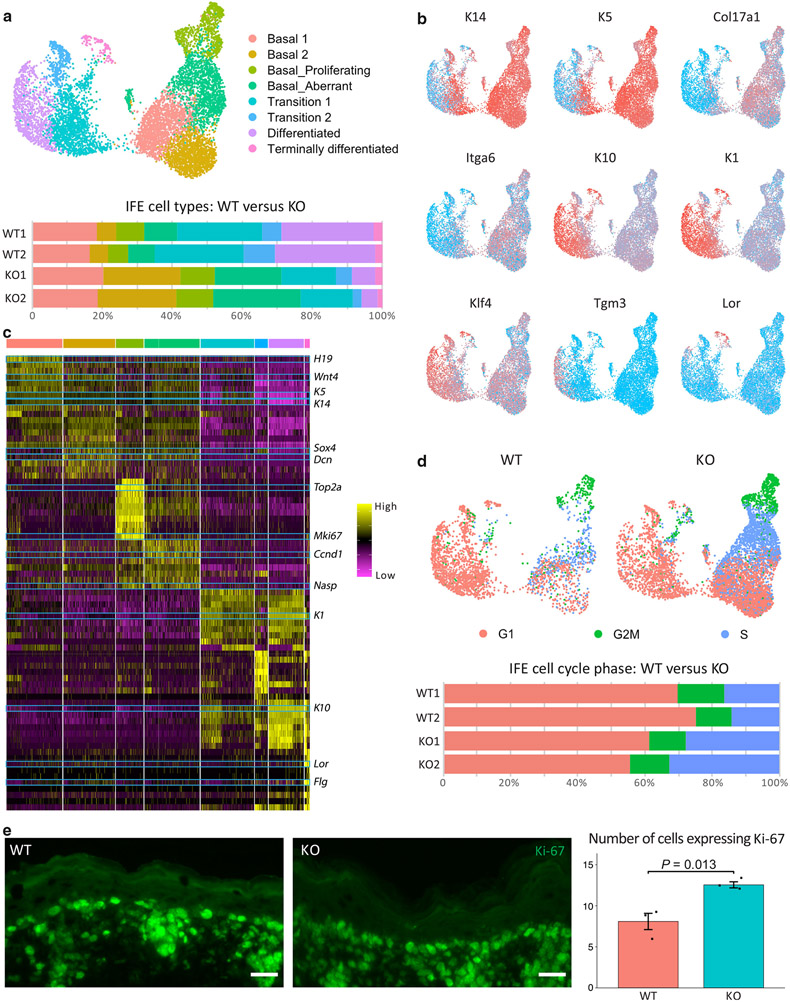
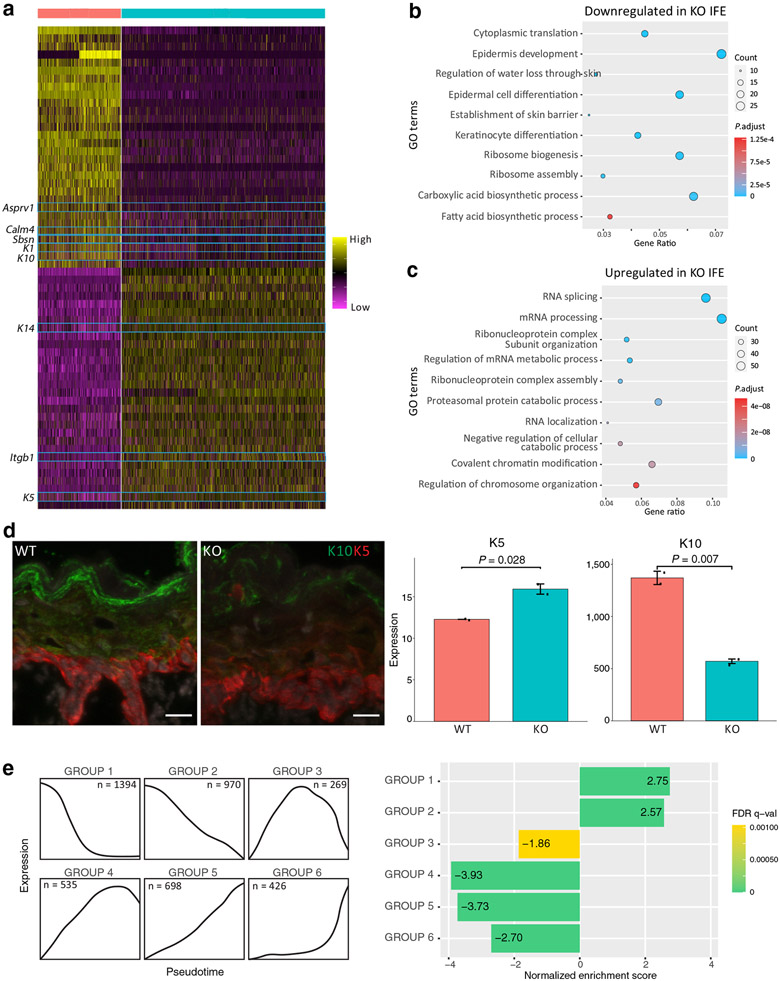
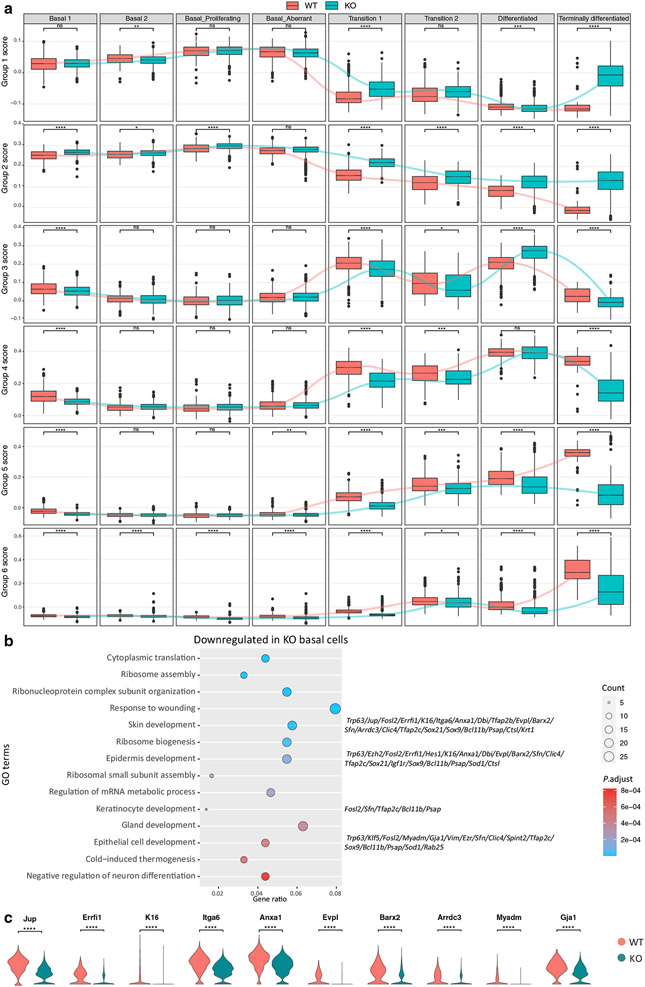
The M3 muscarinic acetylcholine receptor is predominantly expressed in the basal epidermal layer where it mediates the effects of the autocrine/paracrine cytotransmitter acetylcholine. Patients with the autoimmune blistering disease pemphigus develop autoantibodies to M3 muscarinic acetylcholine receptor and show alterations in keratinocyte adhesion, proliferation, and differentiation, suggesting that M3 muscarinic acetylcholine receptor controls these cellular functions. Chmr3-/- mice display altered epidermal morphology resembling that seen in patients with pemphigus vulgaris. In this study, we characterized the cellular and molecular mechanisms through which M3 muscarinic acetylcholine receptor controls epidermal structure and function. We used single-cell RNA sequencing to evaluate keratinocyte heterogeneity and identify differentially expressed genes in specific subpopulations of epidermal cells in Chmr3-/- neonatal mice. We found that Chmr3-/- mice feature abnormal epidermal morphology characterized by accumulation of nucleated basal cells, shrinkage of basal keratinocytes, and enlargement of intercellular spaces. These morphologic changes were associated with upregulation of cell proliferation genes and downregulation of genes contributing to epidermal differentiation, extracellular matrix formation, intercellular adhesion, and cell arrangement. These findings provide, to our knowledge, previously unreported insights into how acetylcholine controls epidermal differentiation and lay a groundwork for future translational studies evaluating the therapeutic potential of cholinergic drugs in dermatology.
Copyright © 2022 The Authors. Published by Elsevier Inc. All rights reserved.
Conflict of interest statement
CONFLICT OF INTEREST
The authors state no conflict of interest.
Figures
Similar articles
-
Mechanisms of synergy of autoantibodies to M3 muscarinic acetylcholine receptor and secretory pathway Ca2+/Mn2+-ATPase isoform 1 in patients with non-desmoglein pemphigus vulgaris.Int Immunopharmacol. 2020 Mar;80:106149. doi: 10.1016/j.intimp.2019.106149. Epub 2020 Jan 17. Int Immunopharmacol. 2020. PMID: 31958740
-
Identification and mapping of keratinocyte muscarinic acetylcholine receptor subtypes in human epidermis.J Invest Dermatol. 1998 Sep;111(3):410-6. doi: 10.1046/j.1523-1747.1998.00299.x. J Invest Dermatol. 1998. PMID: 9740233
-
Chronic exposure to the anti-M3 muscarinic acetylcholine receptor autoantibody in pemphigus vulgaris contributes to disease pathophysiology.J Biol Chem. 2022 Mar;298(3):101687. doi: 10.1016/j.jbc.2022.101687. Epub 2022 Feb 7. J Biol Chem. 2022. PMID: 35143842 Free PMC article.
-
Biological functions of keratinocyte cholinergic receptors.J Investig Dermatol Symp Proc. 1997 Aug;2(1):41-8. doi: 10.1038/jidsymp.1997.10. J Investig Dermatol Symp Proc. 1997. PMID: 9487015 Review.
-
Alteration of cholinergic system in keratinocytes cells produces acantholysis: a possible use of cholinergic drugs in pemphigus vulgaris.Antiinflamm Antiallergy Agents Med Chem. 2012;11(3):238-42. doi: 10.2174/1871523011202030238. Antiinflamm Antiallergy Agents Med Chem. 2012. PMID: 23140385 Review.
Cited by
-
Impaired Molecular Mechanisms Contributing to Chronic Pain in Patients with Hidradenitis Suppurativa: Exploring Potential Biomarkers and Therapeutic Targets.Int J Mol Sci. 2025 Jan 25;26(3):1039. doi: 10.3390/ijms26031039. Int J Mol Sci. 2025. PMID: 39940809 Free PMC article.
-
B cell-derived acetylcholine mitigates skin inflammation in mice through α9 nicotinic acetylcholine receptor-mediated signaling.Proc Natl Acad Sci U S A. 2025 Apr 29;122(17):e2501960122. doi: 10.1073/pnas.2501960122. Epub 2025 Apr 23. Proc Natl Acad Sci U S A. 2025. PMID: 40267137
-
The M3 Muscarinic Acetylcholine Receptor Can Signal through Multiple G Protein Families.Mol Pharmacol. 2024 May 17;105(6):386-394. doi: 10.1124/molpharm.123.000818. Mol Pharmacol. 2024. PMID: 38641412 Free PMC article.
-
Epitomic profiling and functional characteristics of pemphigus vulgaris autoantibody binding to keratinocyte M3 muscarinic acetylcholine receptor.J Biol Chem. 2025 Apr;301(4):108434. doi: 10.1016/j.jbc.2025.108434. Epub 2025 Mar 20. J Biol Chem. 2025. PMID: 40120680 Free PMC article.
-
Associations of genetic variations in the M3 receptor with salt sensitivity, longitudinal changes in blood pressure and the incidence of hypertension in Chinese adults.J Clin Hypertens (Greenwich). 2024 Jan;26(1):36-46. doi: 10.1111/jch.14753. Epub 2023 Nov 27. J Clin Hypertens (Greenwich). 2024. PMID: 38010846 Free PMC article.
References
-
- Arredondo J, Hall LL, Ndoye A, Chernyavsky AI, Jolkovsky DL, Grando SA. Muscarinic acetylcholine receptors regulating cell cycle progression are expressed in human gingival keratinocytes [published correction appears in J Periodont Res 2004;39:79] J Periodont Res 2003;38:79–89. - PubMed
-
- Chang MC. Areca nut extract and arecoline induced the cell cycle arrest but not apoptosis of cultured oral KB epithelial cells: association of glutathione, reactive oxygen species and mitochondrial membrane potential. Carcinogenesis 2001;22:1527–35. - PubMed
-
- Chen H, Zhang M, Zhang W, Li Y, Zhu J, Zhang X, et al. Downregulation of BarH-like homeobox 2 promotes cell proliferation, migration and aerobic glycolysis through wnt/ β-catenin signaling, and predicts a poor prognosis in non-small cell lung carcinoma: Barx2 and non-small cell lung carcinoma. Thorac Cancer 2018;9:390–9. - PMC - PubMed
-
- Chen J, Cheuk IWY, Shin VY, Kwong A. Acetylcholine receptors: key players in cancer development. Surg Oncol 2019;31:46–53. - PubMed
Publication types
MeSH terms
Substances
Grants and funding
LinkOut - more resources
Full Text Sources
Medical
Molecular Biology Databases
