. 2022 Oct:217:102332.
doi: 10.1016/j.pneurobio.2022.102332. Epub 2022 Jul 21.

Traumatic brain injury recapitulates developmental changes of axons

Affiliations

Traumatic brain injury recapitulates developmental changes of axons

Hailong Song et al. Prog Neurobiol. 2022 Oct.

Abstract

During development, half of brain white matter axons are maintained for growth, while the remainder undergo developmental axon degeneration. After traumatic brain injury (TBI), injured axons also appear to follow pathways leading to either degeneration or repair. These observations raise the intriguing, but unexamined possibility that TBI recapitulates developmental axonal programs. Here, we examined axonal changes in the developing brain in young rats and after TBI in adult rat. Multiple shared changes in axonal microtubule (MT) through tubulin post-translational modifications and MT associated proteins (MAPs), tau and MAP6, were found in both development and TBI. Specifically, degenerating axons in both development and TBI underwent phosphorylation of tau and excessive tubulin tyrosination, suggesting MT instability and depolyermization. Conversely, nearby axons without degenerating morphologies, had increased MAP6 expression and maintenance of tubulin acetylation, suggesting enhanced MT stabilization, thereby supporting survival or repair. Quantitative proteomics revealed similar signaling pathways of axon degeneration and growth/repair, including protein clusters and networks. This comparison approach demonstrates how focused evaluation of developmental processes may provide insight into pathways initiated by TBI. In particular, the data suggest that TBI may reawaken dormant axonal programs that direct axons towards either degeneration or growth/repair, supporting further study in this area.

Keywords: Axon; Developmental axon degeneration; MAP6; Tau; Traumatic brain injury; Tubulin post-translational modifications.


Conflict of interest statement

Competing interests None.

Figures

Fig. 1.
Fig. 1.. Axon degeneration changes and tubulin PTMs.
(A) Western blot analysis of APP (110–130kD) and actin (42kD) were shown. Naïve adult and sham control animals were pooled as “N/S Adult” for further WB quantification due to no major protein expression difference between the two groups. (B) APP IHC stainings were compared between DAD and TBI. During DAD, sporadic profile of APP staining was captured in the white matter (corpus callosum) (scale bar = 100μm), with no APP staining identified in naïve adult or sham control animals (scale bar = 50μm). In contrast, extensive APP accumulations were observed after TBI. i–ii) Various forms of white matter (corpus callosum and external capsule) APP positive swellings were observed, including terminal swelling and beading (white notched arrows indicated the enlarged regions shown in the insets) (scale bar = 100μm (i) and 50μm (ii)). iii) Focal APP pathologies were observed in the cortical area relevant to the FPI injury (scale bar = 50μm (left) and 25μm (right)). iv) APP fusiform accumulations were also seen in white matter (white arrows pointed to beadings in adjacent to large swellings suggesting of axonal transport interruption) (scale bar = 10μm (left) and 25μm (right)). (C) WB analysis of tubulin PTMs were shown. (D) Quantitative comparisons of total α-tubulin, Acetyl-Tub, PolyGlu-Tub, Tyr-Tub, DeTyr-Tub, and Tyr/DeTyr-Tub expressions were measured. (E–G) IF staining of Acetyl-Tub (red) and APP (green) were shown (scale bar = 25μm). White arrows pointed to APP positive swollen axonal profiles with no obvious Acetyl-Tub expression observed. The upper panel represented subcortical white matter region, while the rests showed cortical staining. (F) Similarly, PolyGlu-Tub (red) and APP (green) IF staining were shown (scale bar = 50μm). (G) IF staining of Tyr-Tub (red) and APP (green) were shown (scale bar = 50μm). White arrows pointed to co-localizations of Tyr-Tub and APP positive swollen axonal profiles. Again, the upper panel represented subcortical white matter region, while the rests showed cortical staining.
Fig. 2.
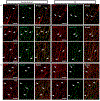
Fig. 2.. Changes in tau and MAP6 expressions during development and after TBI.
(A) Western blot analysis of soluble phosphorylated tau (~60kD), total tau (Tau5) (45–68kD), and actin (42kD) were shown. (B) AT8 IHC stainings were compared between DAD and TBI. Widespread phosphorylated tau at Ser202/Thr205 were captured in cortex during DAD (white notched arrows indicate the enlarged regions shown in the insets, scale bar = 100μm). i–v) Focal and sparse AT8 stained phosphorylated tau depositions in the cell body from the ipsilateral cortical area were captured at 24 hours post TBI (i, white arrowhead indicated the enlarged regions shown in the insets, scale bar = 100μm; ii, scale bar= 25μm). Grain-like (small round) profiles were also observed (iii, white arrows pointed to a few AT8 positive profiles likely along the axon, scale bar = 10μm). AT8 swollen profiles (dense granular like) were shown in the white matter (corpus callosum and external capsule) as well (lower panels, scale bar = 25μm (iv) and 10μm (v)). (C–D) Western bot analysis of MAP6 and actin were shown. Different MAP6 isoforms were marked as MAP6-N (neuronal) isoform at ~125kD, MAP6-E (embryonic) isoform at ~90kD, and MAP6-70kD isoform at ~70kD. (E) IF staining of MAP6 (red) and APP (green) profiles compared between development and TBI were shown (scale bar = 50μm). (F) The percentage of MAP6 expressions and relative intensities were compared between control and TBI animals (separating APP positive vs negative axons).
Fig. 3.
Fig. 3.. IF co-localization between tau, MAP6 and different tubulin PTMs during development and after TBI.
(A) IF staining showed no obvious AT8 (red) and DeTyr-Tub (green) co-localization (scale bar = 25μm). (Other tubulin PTM markers, including Tyr-Tub antibodies, are from the same source as p-tau. Therefore, a directly co-localization with those markers is unable to achieve). (B) IF staining showed evident co-localization between MAP6 (red) and Acetyl-Tub (green) (scale bar = 25μm). (C) IF staining showed no obvious MAP6 (red) and Tyr-Tub (green) co-localization (scale bar = 25μm).
Fig. 4.
Fig. 4.. Global protein expressions and biological annotations during development and after TBI.
(A) Data-independent acquisition (DIA)-based LC-MS/MS quantitative proteomics workflow. (B) PCA analyses showed clear separation of differentially expressed proteins among various groups. (C) Volcano plots showed the distribution of all proteins identified and compared between P5 and TBI. Dashed lines indicated the thresholds of log2 (Fold change). Red, green, and black dots represented upregulated, downregulated, and unchanged protein, respectively. Numbers of differentially expressed proteins were marked as n. (D) Major cellular components identified and compared between P5 and TBI. The length of the bar represented the significance of each GO enrichment (-log10 (p value)), and the size of the circle represented the total numbers of proteins enriched. (E) Top canonical pathways enriched and compared between P5 and TBI. The canonical pathways were ranked based on the -log10 (p value), and the size of the circle represented the total numbers of proteins enriched.
Fig. 5.
Fig. 5.. Correlation analysis revealed modules related to development and TBI.
(A) Weighted gene correlation network analysis (WGCNA) identified three significant protein modules associated with developmental stages. The total numbers of protein were listed in each module. Non-linear trajectories were represented as postnatal days (x-axis) relative to module eigengenes (MEs) expression (y-axis). (B) Enrichments of biological process, cellular components, and KEGG pathway were shown for P5 module 3 during development. (C–D) WGCNA identified another three significant protein modules associated with TBI and enrichments were shown for TBI module 3 related to axon.
Fig. 6.
Fig. 6.. Functional network, protein-protein interaction, and Reactome analysis highlighted axonal protein involvement during development and after TBI.
(A) Functional networks revealed dynamic axon and cytoskeleton regulation during DAD and following TBI. (B) Relative expression changes of axonal proteins relevant to those networks were compared between P5 and TBI. (C) Interactions of relevant differentially expressed proteins was shown using IPA. Red and green colors coded proteins represented upregulation and downregulation, respectively. The degree of regulation was manifested by the color intensity. Solid lines in the network implied direct interactions between proteins, and dashed lines indicate indirect interactions. Geometric shapes represented different general functional families of gene regulation (standing oval for ion channel, flat oval for transcription regulator, trapezoid for transporter, three triangles for kinase, irregular for enzyme, deltoid with empty circle inside for peptidase, and circle for others). (D) Wind rose graph illustrated the list of specific PTMs pathways enriched in Reactome knowledgebase (R-RNO-597592). The color of each represented a single PTMs pathway. The height of the bar was based and ranked on the p value of each pathway.
Fig. 7.
Fig. 7.. Evolving axonal MT changes that are shared between development and TBI.
For both development and TAI due to TBI, axons appear to be selected for one of two opposing pathways that lead to either loss or maintain of MT stability, therefore possibly leading to axon degeneration (red arrows) or growth/repair (green arrows). Changes in axonal MTs regulated by tubulin PTMs and MAPs may play a key role in defining each pathway. TAI induces MT damage and accumulation of APP. For both development and TBI, disconnection of tau from MTs and its subsequent phosphorylation is associated with loss of MT stabilization and axon degeneration. Conversely, enhanced MT stabilization with MAP6 supports MT stabilization and possibly determining axon growth/repair.

Similar articles

Cited by

References

    1. Abu Hamdeh S, Shevchenko G, Mi J, Musunuri S, Bergquist J, Marklund N, 2018. Proteomic differences between focal and diffuse traumatic brain injury in human brain tissue. Sci Rep 8, 6807. - PMC - PubMed
    1. Ahmadzadeh H, Smith DH, Shenoy VB, 2015. Mechanical Effects of Dynamic Binding between Tau Proteins on Microtubules during Axonal Injury. Biophys J 109, 2328–2337. - PMC - PubMed
    1. Baas PW, Ahmad FJ, 2013. Beyond taxol: microtubule-based treatment of disease and injury of the nervous system. Brain 136, 2937–2951. - PMC - PubMed
    1. Baas PW, Rao AN, Matamoros AJ, Leo L, 2016. Stability properties of neuronal microtubules. Cytoskeleton (Hoboken) 73, 442–460. - PMC - PubMed
    1. Bagri A, Cheng HJ, Yaron A, Pleasure SJ, Tessier-Lavigne M, 2003. Stereotyped pruning of long hippocampal axon branches triggered by retraction inducers of the semaphorin family. Cell 113, 285–299. - PubMed

Publication types