. 2022 Jul 23;22(1):184.
doi: 10.1186/s12866-022-02594-y.

Analysis of gastric microbiome reveals three distinctive microbial communities associated with the occurrence of gastric cancer

Affiliations

Analysis of gastric microbiome reveals three distinctive microbial communities associated with the occurrence of gastric cancer

Dehua Liu et al. BMC Microbiol. .

Abstract

Background: Gastric microbial dysbiosis were reported to be associated with gastric cancer (GC). This study aimed to explore the variation, diversity, and composition patterns of gastric bacteria in stages of gastric carcinogenesis based on the published datasets.

Methods: We conducted a gastric microbial analysis using 10 public datasets based on 16S rRNA sequencing, including 1270 gastric biopsies of 109 health control, 183 superficial gastritis (SG), 135 atrophic gastritis (AG), 124 intestinal metaplasia (IM), 94 intraepithelial neoplasia (IN), 344 GC, and 281 adjacent normal tissues. And QIIME2-pipeline, DESeq2, NetMoss2, vegan, igraph, and RandomForest were used for the data processing and analysis.

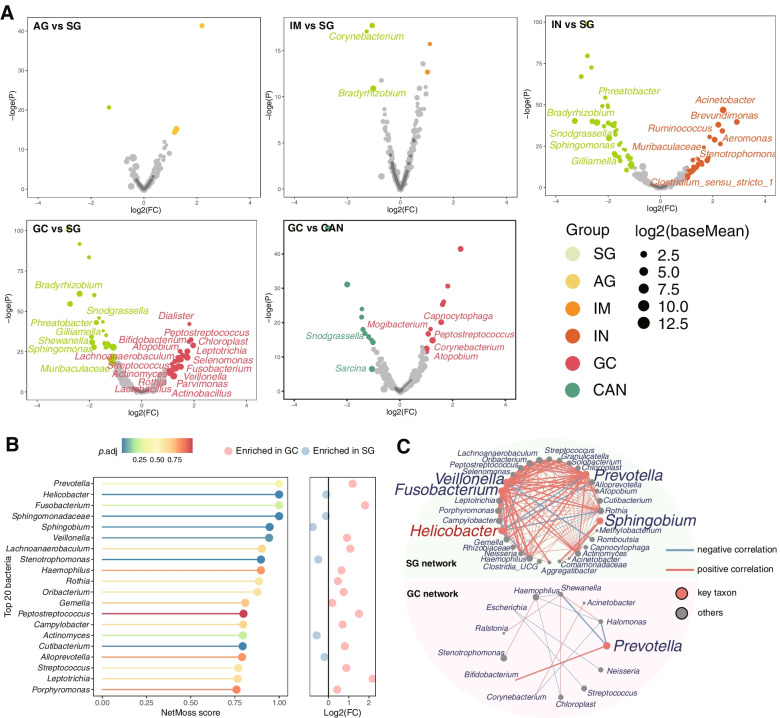
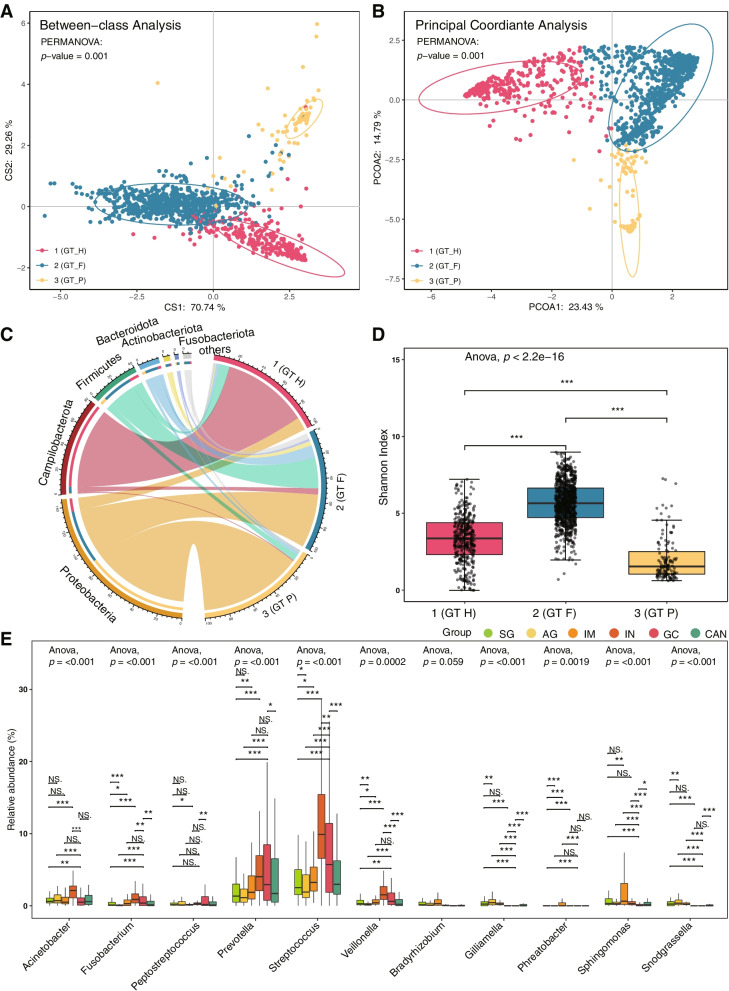
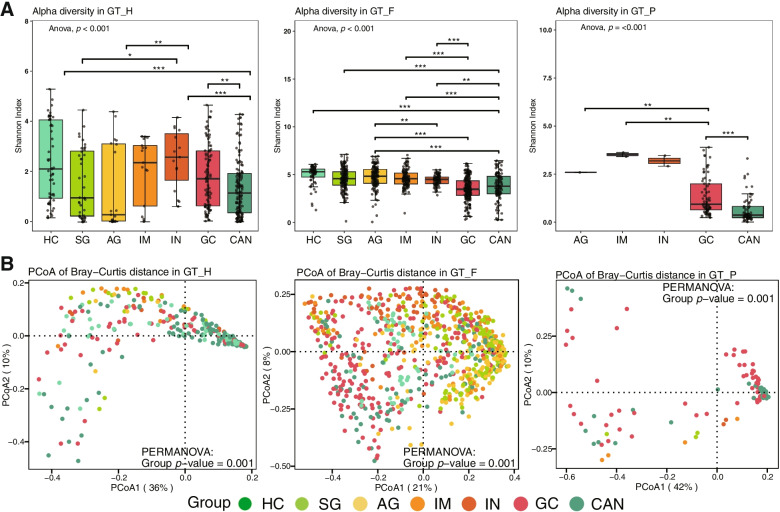
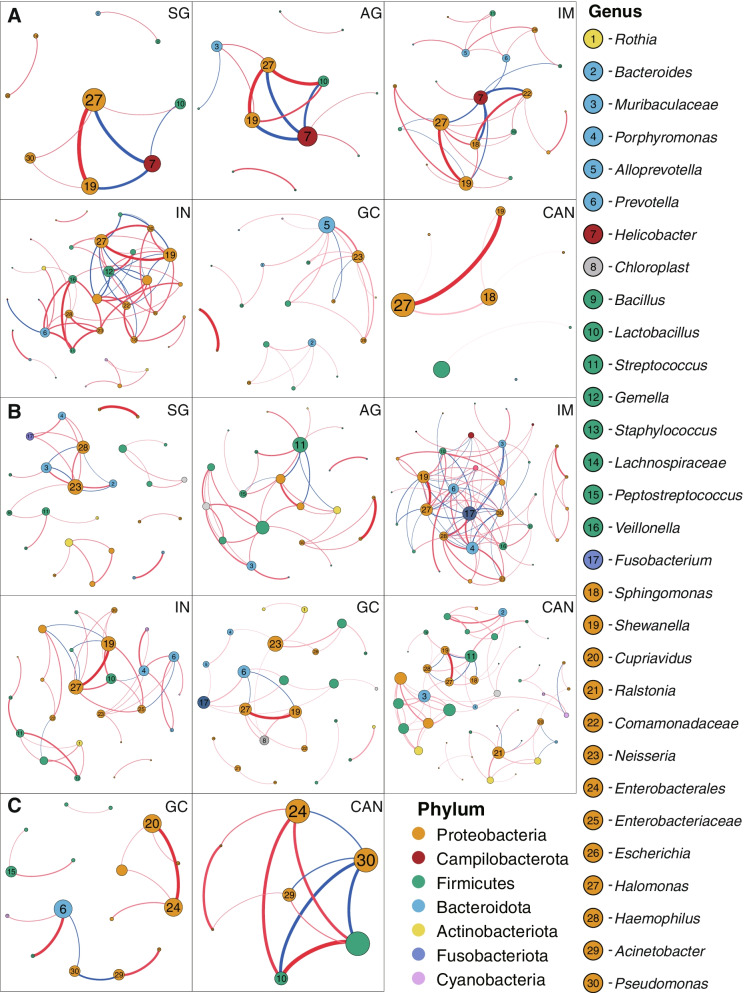
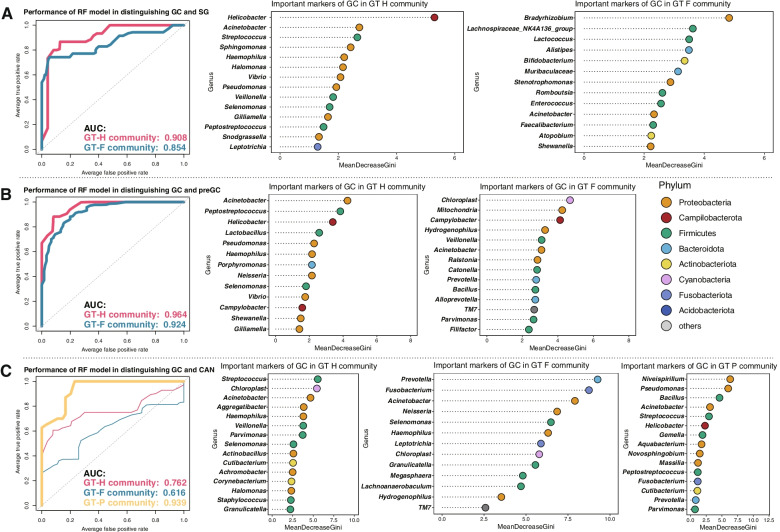
Results: We identified three gastric microbial communities among all the gastric tissues. The first community (designate as GT-H) was featured by the high abundance of Helicobacter. The other two microbial communities, namely GT-F, and GT-P, were featured by the enrichment of phylum Firmicutes and Proteobacteria, respectively. The distribution of GC-associated bacteria, such as Fusobacterium, Peptostreptococcus, Streptococcus, and Veillonella were enriched in tumor tissues, and mainly distributed in GT-F type microbial communities. Compared with SG, AG, and IM, the bacterial diversity in GC was significantly reduced. And the strength of microbial interaction networks was initially increased in IM but gradually decreased from IN to GC. In addition, Randomforest models constructed in in GT-H and GT-F microbial communities showed excellent performance in distinguishing GC from SG and precancerous stages, with varied donated bacteria.

Conclusions: This study identified three types of gastric microbiome with different patterns of composition which helps to clarify the potential key bacteria in the development of gastric carcinogenesis.

Keywords: Bacterial community; Gastric cancer; Microbiota; Predictive model.


Conflict of interest statement

I declare that the authors have no competing interests as defined by BMC, or other interests that might be perceived to influence the results and/or discussion reported in this paper.

Figures

Fig. 1
Fig. 1
A DESeq2 identifies specific bacterial taxa associated with the development of GC, with age, gender, H. pylori, and batch effects adjusted. B NetMoss2 identifies specific bacterial taxa in microbial Sparcc networks between GC and SG. C Sparcc networks between GC and SG constructed by NetMoss2. HC: health control, SG: superficial gastritis, AG: atrophic gastritis, IM: intestinal metaplasia, IN: intraepithelial neoplasia, GC: gastric cancer, CAN: carcinoma adjacent normal tissues. Log2(FC): Log2(Fold Change), -loge(P): the negative of log base e of P value
Fig. 2
Fig. 2
Differences of microbial composition and diversity between three bacterial communities. A, B The multidimensional cluster analysis of the gastric microbiome at the genus level shows three distinct clusters of samples. C The abundance of the gastric microbiota is shown for phylum level in three microbial communities. D Alpha diversity was estimated by the Shannon index at the genus level for three microbial communities. E The relative abundance of significantly changed bacteria in GT-F type samples among different disease groups. GT: gastric type. *: p.adj < 0.05, **: p.adj < 0.01, ***: p.adj < 0.001
Fig. 3
Fig. 3
Gastric microbial diversity and community structure at the genus level among disease groups. A Alpha diversity was estimated by Shannon diversity index for disease groups. B PCoA plots and PERMANOVA test based on Bray–Curtis distance for disease groups. HC: health control, SG: superficial gastritis, AG: atrophic gastritis, IM: intestinal metaplasia, IN: intraepithelial neoplasia, GC: gastric cancer, CAN: carcinoma adjacent normal tissues. *: adjusted p < 0.05, **: adjusted p < 0.01, ***: adjusted p < 0.001
Fig. 4
Fig. 4
Correlation networks of the gastrointestinal genus among disease groups. A The interactions of bacteria in gastric biopsies in samples of GT-H. B The interactions of bacteria in samples of GT-F. C The interactions of bacteria in samples of GT-P. The size of nodes corresponds to weighted node connectivity scores, and the nodes were colored by phylum. Red edges denote positive correlations and blue edges denote negative correlations. The interactions of bacteria in GC and CAN groups were exhibited with strengths > 0.4, and in SG, AG, IM, IN groups with strengths > 0.6. HC: health control, SG: superficial gastritis, AG: atrophic gastritis, IM: intestinal metaplasia, IN: intraepithelial neoplasia, GC: gastric cancer, CAN: carcinoma adjacent normal tissues
Fig. 5
Fig. 5
Based on genera selected by Boruta, the performance of gastric microbial models in prediction GC was analysed by receiver operating characteristic (ROC) curve analysis. A The discriminatory potential of microbial model in distinguishing GC and SG. B The discriminatory potential of microbial model in distinguishing GC and precancerous lesions, including AG, IM, and IN. C The discriminatory potential of microbial model in distinguishing GC and CAN. SG: superficial gastritis, IM: intestinal metaplasia, GC: gastric cancer, CAN: carcinoma adjacent normal tissues, preGC: precancerous lesions of gastric cancer. AUC: area under the curve

References

    1. Sung H, Ferlay J, Siegel RL, Laversanne M, Soerjomataram I, Jemal A, et al. Global cancer statistics 2020: GLOBOCAN estimates of incidence and mortality worldwide for 36 cancers in 185 countries. CA Cancer J Clin. 2021;71(3):209–249. doi: 10.3322/caac.21660. - DOI - PubMed
    1. Cai Q, Zhu C, Yuan Y, Feng Q, Feng Y, Hao Y, et al. Development and validation of a prediction rule for estimating gastric cancer risk in the Chinese high-risk population: a nationwide multicentre study. Gut. 2019;68(9):1576–1587. doi: 10.1136/gutjnl-2018-317556. - DOI - PMC - PubMed
    1. Stewart OA, Wu F, Chen Y. The role of gastric microbiota in gastric cancer. Gut Microbes. 2020;11(5):1220–2123. doi: 10.1080/19490976.2020.1762520. - DOI - PMC - PubMed
    1. Ferreira RM, Pereira-Marques J, Pinto-Ribeiro I, Costa JL, Carneiro F, Machado JC, et al. Gastric microbial community profiling reveals a dysbiotic cancer-associated microbiota. Gut. 2018;67(2):226–236. doi: 10.1136/gutjnl-2017-314205. - DOI - PMC - PubMed
    1. Castano-Rodriguez N, Goh KL, Fock KM, Mitchell HM, Kaakoush NO. Dysbiosis of the microbiome in gastric carcinogenesis. Sci Rep. 2017;7(1):15957. doi: 10.1038/s41598-017-16289-2. - DOI - PMC - PubMed

Substances