. 2022 Jul 23;13(1):40.
doi: 10.1186/s13293-022-00452-0.

Sex-biased and parental allele-specific gene regulation by KDM6A

Affiliations

Sex-biased and parental allele-specific gene regulation by KDM6A

Wenxiu Ma et al. Biol Sex Differ. .

Abstract

Background: KDM6A is a demethylase encoded by a gene with female-biased expression due to escape from X inactivation. Its main role is to facilitate gene expression through removal of the repressive H3K27me3 mark, with evidence of some additional histone demethylase-independent functions. KDM6A mutations have been implicated in congenital disorders such as Kabuki Syndrome, as well as in sex differences in cancer.

Methods: Kdm6a was knocked out using CRISPR/Cas9 gene editing in F1 male and female mouse embryonic stem cells (ES) derived from reciprocal crosses between C57BL6 x Mus castaneus. Diploid and allelic RNA-seq analyses were done to compare gene expression between wild-type and Kdm6a knockout (KO) clones. The effects of Kdm6a KO on sex-biased gene expression were investigated by comparing gene expression between male and female ES cells. Changes in H3K27me3 enrichment and chromatin accessibility at promoter regions of genes with expression changes were characterized by ChIP-seq and ATAC-seq followed by diploid and allelic analyses.

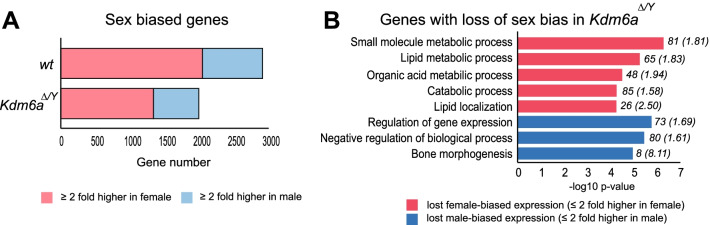
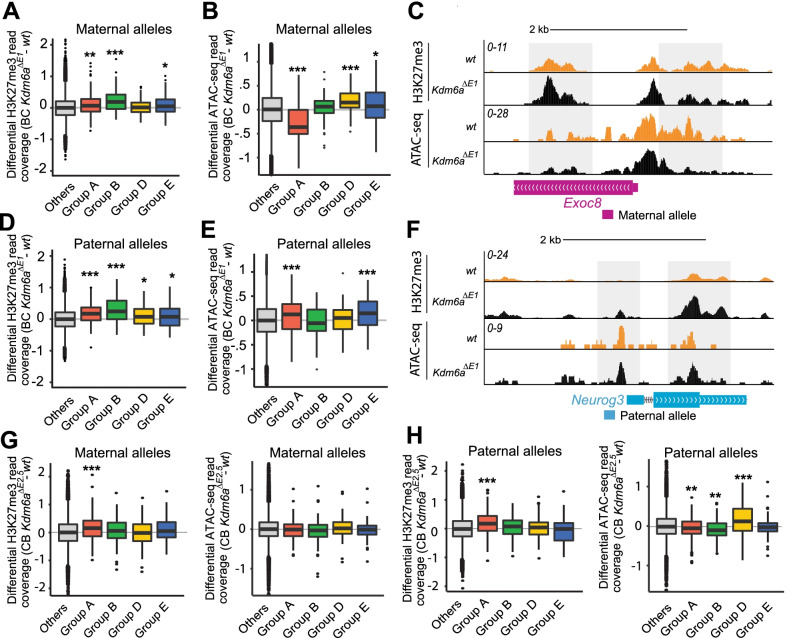
Results: We report that Kdm6a KO in male and female embryonic stem (ES) cells derived from F1 hybrid mice cause extensive gene dysregulation, disruption of sex biases, and specific parental allele effects. Among the dysregulated genes are candidate genes that may explain abnormal developmental features of Kabuki syndrome caused by KDM6A mutations in human. Strikingly, Kdm6a knockouts result in a decrease in sex-biased expression and in preferential downregulation of the maternal alleles of a number of genes. Most promoters of dysregulated genes show concordant epigenetic changes including gain of H3K27me3 and loss of chromatin accessibility, but there was less concordance when considering allelic changes.

Conclusions: Our study reveals new sex-related roles of KDM6A in the regulation of developmental genes, the maintenance of sex-biased gene expression, and the differential expression of parental alleles.

Keywords: Allele-specific; Chromatin; Development; Epigenetics; Gene regulation; Histone methylation; Imprinting; Parent-of-origin; Sex biases.


Conflict of interest statement

The authors declare no competing interests.

Figures

Fig. 1
Fig. 1
Global gene expression changes after Kdm6a KO in BC and CB clones. A Schematic illustrating the Kdm6a CRISPR deletions in BC and CB ES cells. Also included are clone identifiers (see Additional file 8). Exonic (E) deletion results in the loss of about 45 kb in length while the promoter (P) deletion results in a loss of about 4 kb in length. B, C Scatter plots of differential gene expression in three BC male Kdm6aΔ/Y clones (Kdm6aΔE1, Kdm6aΔE3, and Kdm6aΔP4) versus two male BC wt clones (B), and three CB male Kdm6a Δ/Y clones (Kdm6aΔE2.5, Kdm6aΔE2.7, and Kdm6aΔP2.1) versus two CB male wt clones (C). Log2 values of genes with > 1TPM in at least one replicate are shown. Downregulated DEGs are labeled in red, upregulated DEGs in green, and genes lacking differential expression in grey. DESeq2 was employed to identify differentially expressed genes (DEGs) in each cross using an FDR cutoff of < 0.05 and a ≥ 1.5 fold-change. D Venn diagrams of downregulated and upregulated genes as measured by a ≥ 1.25 fold change in log2 TPM in male BC and CB Kdm6aΔ/Y clones versus wt. E GO analysis of dysregulated genes with a ≥ 1.25 fold change in log2 TPM found in common between the BC and CB crosses. Numbers in parentheses represent the fold enrichment over expected number of genes within a given biological process, while those not in parentheses represent the number of genes in each category. F Log2 expression fold changes for genes dysregulated in male Kdm6aΔ/Y clones derived from BC and CB crosses. The genes shown are associated with processes implicated in phenotypes seen in Kabuki syndrome (*p ≤ 0.05; **p ≤ 0.01; Has2 p = .05). See also Additional file 9
Fig. 2
Fig. 2
Sex-biased gene expression changes in BC Kdm6a KO cells. (A) Number of genes with sex-biased expression (≥ twofold TPM difference cut off; p < 0.05) in BC wt and Kdm6aΔ/Y clones. Overall, there was a greater loss of female-biased genes (pink) than male-biased genes (blue). See also Table 1 and Additional file 10A, B. (B) GO analysis of genes with loss of sex-biased expression in Kdm6aΔ/Y. Numbers in parentheses represent the fold enrichment over expected number of genes within a given biological process, while those not in parentheses represent the number of genes in each category
Fig. 3
Fig. 3
Allele-specific gene expression changes after Kdm6a KO in male BC and CB clones. A, B Heatmaps of allelic gene expression normalized to the mean of each gene across alleles show the extent of fold changes for maternal (purple) and paternal (dark blue) alleles of downregulated DEGs (DESeq2—≥ 1.5 fold change and FDR < 0.05) (A) and upregulated DEGs (B) in two male wt controls, three male BC KO clones Kdm6aΔ/Y including two clones Kdm6aΔ/E with an exon 2–4 deletion (Kdm6aΔE1 Kdm6aΔE3) and one clone with a promoter deletion (Kdm6aΔP4). The genotypes of the clones are color-coded at the top. X-linked gene expression from the paternal allele was masked as zero (white boxes). Z scores (color-coded) representing deviations from the mean for each row are shown for each group of genes. C, D Same analysis as in (A, B) for but for CB clones. See also Table 2 and Additional file 11: Table S11. Group A includes genes downregulated on the maternal allele, group B, on the paternal allele, and group C, on both alleles. Group D includes genes upregulated on the maternal allele, group E, on the paternal allele, and group F, on both alleles
Fig. 4
Fig. 4
Diploid changes in H3K27me3 and chromatin accessibility after Kdm6a KO in BC and CB clones. A UCSC Genome browser (GRCm38/mm10) view of H3K27me3 profiles in wt and Kdm6aΔE1 confirms a general increase across the entire Hoxb locus following Kdm6a KO. wt (black); KO cells (orange). B Box plots of average ratios of H3K27me3 read coverage in BC (Kdm6aΔE1) and CB KO clones (Kdm6aΔE2.5) versus wt at promoters (± 2 kb of the TSS) of genes with similar changes between the reciprocal crosses. Downregulated and upregulated genes exhibit expected increases and decreases in H3K27me3 (***p ≤ 0.0001). C Same analysis as in (B), but for ATAC-seq average ratios of read coverage. Downregulated and upregulated genes exhibit the expected decreases and increases in chromatin accessibility (***p ≤ 0.0001; **p = 0.011). D Example profiles of H3K27me3 read coverage in wt (black) and KO cells (orange) show an increase at promoters of downregulated genes (Tnik, Has2, Ephb6) in BC and CB KO clones. (UCSC Genome browser GRCm38/mm10)
Fig. 5
Fig. 5
Allelic changes in H3K27me3 and chromatin accessibility after Kdm6a KO in BC and CB clones. A, B Box plots show average ratios of H3K27me3 (A) and ATAC-seq (B) read coverage between clone Kdm6aΔE1 and wt cells at promoters (± 2 kb of the TSS) on maternal alleles. Both downregulated groups (A and B) show a significant increase in H3K27me3 levels on maternal alleles (A **p = 0.001; B ***p = 5.33e−06). Maternally downregulated genes (group A) show significant loss of chromatin accessibility (***p = 5.9e−11) on the maternal allele in KO cells, while paternally downregulated genes (group B) do not. Upregulated groups (D and E) show no or slight changes in H3K27me3 (E *p = 0.020), and show the expected increase in chromatin accessibility (D ***p = 2.4e−07; E *p = 0.03). Values were normalized to the input and converted to log scale. C UCSC Genome browser (GRCm38/mm10) view of maternal H3K27me3 and chromatin accessibility profiles in wt (−) and Kdm6aΔE1 ( +) at the maternally downregulated gene Exoc8 shows an increase in H3K27me3 and a corresponding decrease in ATAC-seq around the promoter. D, E Same analysis as in (A, B) but for paternal alleles. Both downregulated groups (A and B) show an increase in H3K27me3 levels (A ***p = 4.32e−07; B ***p = 1.73e−06), while upregulated groups (D and E) show a slight but significant increase (D *p = 0.03; E *p = 0.04). Only maternally downregulated group A and paternally upregulated group E show significant changes in ATAC-seq (A ***p = 0.0001; B ***p = 0.001) at paternal alleles. F UCSC Genome browser (GRCm38/mm10) view of paternal H3K27me3 and chromatin accessibility profiles in wt (−) and Kdm6aΔE1 ( +) at the paternally downregulated Neurog3 gene shows increased H3K27me3 but no corresponding decrease in ATAC-seq around the promoter. G Same analysis as in (A, B) but in the CB Kdm6aΔE2.5 clone. Only maternally downregulated genes (group A) show increased H3K27me3. There were no significant ATAC-seq changes. H Same analysis as in (D, E) but in the CB Kdm6aΔE2.5 clone. Maternally downregulated group A show increased H3K27me3, while ATAC-seq changes were only seen on paternal alleles. Group A includes genes downregulated on the maternal allele and group B on the paternal allele. Group D includes genes upregulated on the maternal allele and group E, on the paternal allele

References

    1. De Kumar B, Parrish ME, Slaughter BD, Unruh JR, Gogol M, Seidel C, et al. Analysis of dynamic changes in retinoid-induced transcription and epigenetic profiles of murine Hox clusters in ES cells. Genome Res. 2015;25(8):1229–1243. doi: 10.1101/gr.184978.114. - DOI - PMC - PubMed
    1. Dhar SS, Lee SH, Chen K, Zhu G, Oh W, Allton K, et al. An essential role for UTX in resolution and activation of bivalent promoters. Nucleic Acids Res. 2016;44(8):3659–3674. doi: 10.1093/nar/gkv1516. - DOI - PMC - PubMed
    1. Agger K, Cloos PA, Christensen J, Pasini D, Rose S, Rappsilber J, et al. UTX and JMJD3 are histone H3K27 demethylases involved in HOX gene regulation and development. Nature. 2007;449(7163):731–734. doi: 10.1038/nature06145. - DOI - PubMed
    1. Yu J, Wang L, Pei P, Li X, Wu J, Qiu Z, et al. Reduced H3K27me3 leads to abnormal Hox gene expression in neural tube defects. Epigenet Chromatin. 2019;12(1):76. doi: 10.1186/s13072-019-0318-1. - DOI - PMC - PubMed
    1. Seenundun S, Rampalli S, Liu QC, Aziz A, Palii C, Hong S, et al. UTX mediates demethylation of H3K27me3 at muscle-specific genes during myogenesis. EMBO J. 2010;29(8):1401–1411. doi: 10.1038/emboj.2010.37. - DOI - PMC - PubMed

Publication types

Supplementary concepts