. 2022 Jul 23;13(1):4267.
doi: 10.1038/s41467-022-31878-0.

Discovering the drivers of clonal hematopoiesis

Affiliations

Discovering the drivers of clonal hematopoiesis

Oriol Pich et al. Nat Commun. .

Abstract

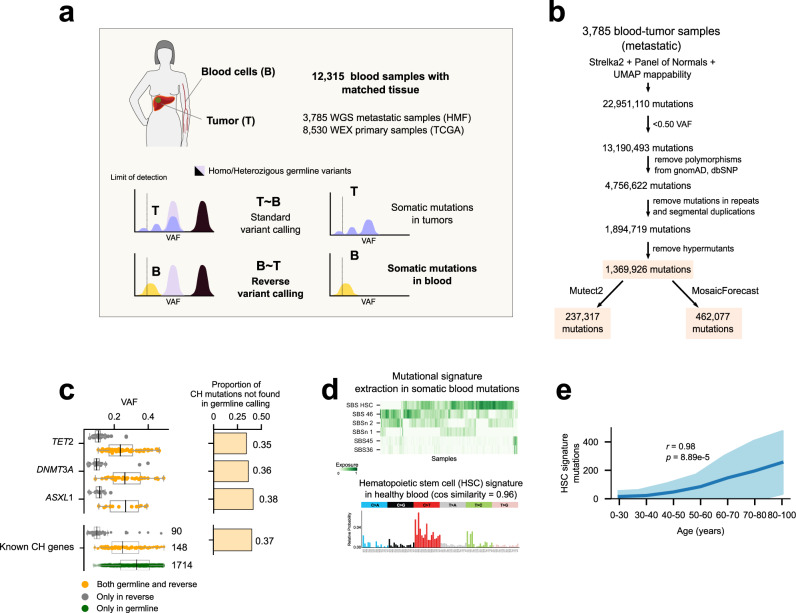
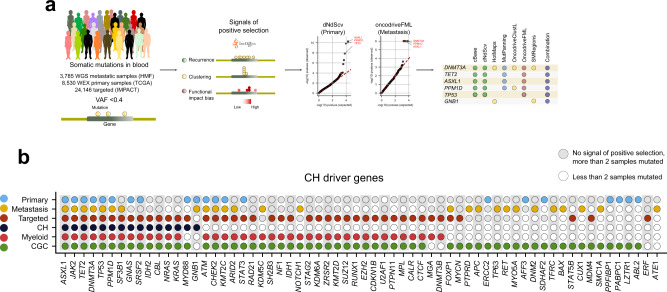
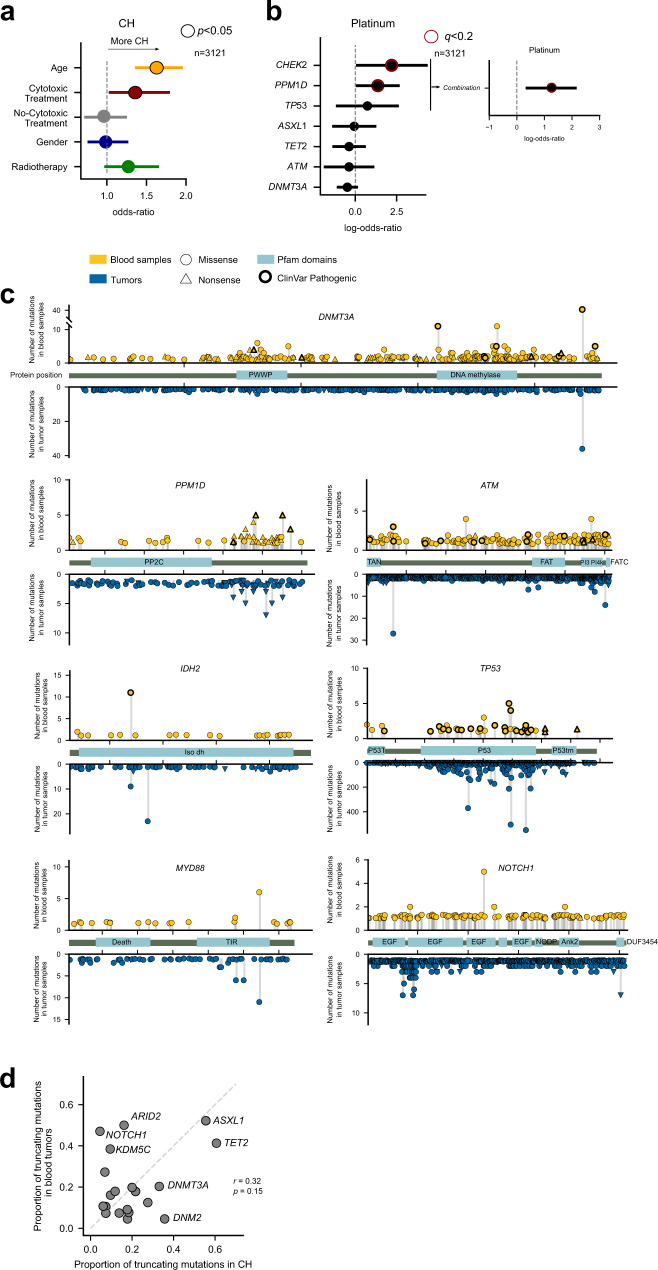
Mutations in genes that confer a selective advantage to hematopoietic stem cells (HSCs) drive clonal hematopoiesis (CH). While some CH drivers have been identified, the compendium of all genes able to drive CH upon mutations in HSCs remains incomplete. Exploiting signals of positive selection in blood somatic mutations may be an effective way to identify CH driver genes, analogously to cancer. Using the tumor sample in blood/tumor pairs as reference, we identify blood somatic mutations across more than 12,000 donors from two large cancer genomics cohorts. The application of IntOGen, a driver discovery pipeline, to both cohorts, and more than 24,000 targeted sequenced samples yields a list of close to 70 genes with signals of positive selection in CH, available at http://www.intogen.org/ch . This approach recovers known CH genes, and discovers other candidates.


Conflict of interest statement

The authors declare no competing interests.

Figures

Fig. 1
Fig. 1. The reverse calling approach to detecting blood somatic mutations.
a Somatic mutations in blood are identified by comparing variants in the blood/tumor paired samples from a cancer patient. We applied this approach to two cohorts of primary and metastasis tumors totalling 12,315 blood donors with no known hematologic malignancy. b Flowchart of the reverse calling and filtering approach. Numbers correspond to mutations remaining in the dataset of the metastasis cohort (full, mosaic or mutect) after each filtering step. c Somatic mutations identified by the reverse calling and a one-sample germline variant calling across blood samples in the metastasis cohort (N = 3,785). Boxplots represent the distribution of VAF of variants affecting well-known CH driver genes identified only by the reverse calling (gray), by both approaches (yellow) or only by the germline calling (green). In the boxplots, the box represents the second and third quartiles, separated by a line indicating the median; the whiskers represent the minimum and maximum of the distribution excluding outliers. Right-hand barplots illustrate the fraction of mutations affecting each gene that are identified only by the reverse calling approach. d Top, activity of mutational signatures in the blood samples of donors across the metastasis cohort (N = 3,785) identified using the mosaic set; bottom, mutational profile of tri-nucleotide probabilities of one of the signatures extracted from the cohort which highly resembles (cosine similarity = 0.96) that of a signature active in healthy hematopoietic stem cells (HSCs). e Relationship between the number of mutations contributed by the HSC signature across blood samples in the metastasis cohort and the (binned) age of their donors. The mean activity of the signature across donors of each bin is represented as the dark blue line, with its standard deviation in light blue color. A significant positive correlation between the two variables is apparent. The p-value corresponds to the Pearson’s regression coefficient. WGS whole genome sequencing, HMF metastasis cohort, TCGA primary cohort, WEX whole exome sequencing, VAF variant allele frequency, CH clonal hematopoiesis, SBS single base substitution, HSC hematopoietic stem cell, cos cosine. Source data for panels c, d and e are provided as Source Data files.
Fig. 2
Fig. 2. Discovery of clonal hematopoiesis driver genes.
a Summary of the discovery analysis applied to blood somatic mutations detected across primary, metastasis and targeted cohorts. The (differently filtered) sets of blood somatic mutations identified across all donors of a cohort were the input data for the analysis. Seven state-of-the-art driver discovery methods probing different signals of positive selection were applied (via the IntOGen pipeline) to each dataset of mutations. The distribution of expected and observed p-values (qq plots) for two of these methods (which implement parametric, non-parametric or empirical statistical tests described in the corresponding original articles) are represented in the panel. The IntOGen pipeline also handles the combination of the output of the seven methods to yield a unified list of CH driver genes in each cohort (details in Supp. Note 1). b CH driver genes discovered across the three cohorts. Genes known to be involved in CH, myeloid malignancies or tumorigenesis in general are labeled with different colors (denoted at the left of the plot). The union of the lists of CH drivers discovered in these three cohorts (64 genes) integrate the CH drivers compendium presented in Supplementary Data file 2 and available through www.intogen.org/ch. IMPACT: targeted cohort, CGC cancer gene census. Source data for panel b are provided as Source Data files.
Fig. 3
Fig. 3. The drivers of clonal hematopoiesis.
a Logistic regression showing the relationship between several factors and the development of CH across 3121 donors with treatment annotation in the metastasis cohorts. For this analysis, a donor is considered to suffer CH if they bear a nonsilent mutation in a CH gene discovered in the analysis of the primary and/or metastasis cohorts. The age of the donors in these cohorts as well as their prior exposure to cytotoxic therapies significantly increase their likelihood of presenting clonal hematopoiesis. The bars represent the 95% confidence interval of the regression coefficients. P-values correspond to the results of the logistic regression. b Logistic regression showing the relationship between the presence of mutations in several genes and the prior exposure of donors in the metastasis cohort to platinum-based therapies across 3121 donors with treatment annotation in the metastasis cohort. Mutations in CHEK2 and PPM1D are significantly more likely detected across platinum-exposed donors. The bars represent the 95% confidence interval of the regression coefficients. P-values correspond to the results of the logistic regression corrected by multiple tests carried out separately for different treatments. c Distribution of blood somatic mutations affecting seven genes selected from the CH drivers compendium across donors of the primary and metastasis cohorts (above the horizontal axis) in comparison to those observed in the same genes across 28076 tumors analyzed by the IntOGen resource (below the horizontal axis). d Relationship between the fraction of truncating variants identified in genes with 10 or more mutations across blood samples in the primary and metastasis cohorts and across several cohorts of tumors. The mutations in tumor samples have been obtained from the IntOGen resource. The p-value corresponds to the Pearson’s correlation coefficient. Source data for panels a, b, c, and d are provided as Source Data files.
Fig. 4
Fig. 4. Clonal hematopoiesis across 12,000 donors.
a Blood somatic mutations in the 20 most recurrently mutated genes in the compendium across the metastasis (top) and primary (bottom) cohorts. b Frequency of mutation of CH drivers across the metastasis and primary cohorts. c The 16 most recurrently mutated hotspots in genes in the CH drivers compendium. d Number of donors in the two cohorts with mutations in genes in one or more CH drivers. e Frequency of co-occurring mutations in genes in the CH drivers compendium. Left, Jaccard’s index; right, frequency of gene pairs co-mutation. f Distribution of the rate of hematopoietic mosaic mutations per year (total number of HSC mutations divided by age) across (left) donors bearing a mutation in genes in the CH drivers compendium (N = 420) and (right) donors with no detected mutations in any of these genes (N = 3,247). The horizontal dashed line extends out of the median of the distribution of rate of mutation per year of age of the donors with mutations in at least one CH gene, representing the donors in the second group that are considered to be cases of clonal hematopoiesis (see next panel). In the boxplots, the box represents the second and third quartiles, separated by a line indicating the median; the whiskers represent the minimum and maximum of the distribution excluding outliers. The two distributions were compared using the two-tailed Wilcoxon-Mann-Whitney test. g Number of donors (above the bars) in the metastasis cohort with clonal hematopoiesis recognizable using different criteria (cumulative bars). First, donors with mutations (detected in the germline calling) in any of the 15 known CH genes; second, donors with variants in known CH genes identified in reverse calling; third, donors with mutations in CH genes discovered across the primary or metastasis cohorts; fourth, donors with mutations in CH genes discovered in the targeted cohort; fifth, donors with no mutation in any gene within the compendium of CH drivers, but with more hematopoiesis mutations per year of age of the donor than the median rate of hematopoiesis mutations across donors in the four previous groups. Source data for panels a, b, c, d, e, f and g are provided as Source Data files.

References

    1. Jaiswal, S. & Ebert, B. L. Clonal hematopoiesis in human aging and disease. Science366, eaan4673 (2019). - PMC - PubMed
    1. Bowman RL, Busque L, Levine RL. Clonal Hematopoiesis and Evolution to Hematopoietic Malignancies. Cell Stem Cell. 2018;22:157–170. doi: 10.1016/j.stem.2018.01.011. - DOI - PMC - PubMed
    1. Busque L, Buscarlet M, Mollica L, Levine RL. Concise Review: Age-Related Clonal Hematopoiesis: Stem Cells Tempting the Devil. STEM CELLS. 2018;36:1287–1294. doi: 10.1002/stem.2845. - DOI - PMC - PubMed
    1. Libby P, et al. Clonal Hematopoiesis: Crossroads of Aging, Cardiovascular Disease, and Cancer: JACC Review Topic of the Week. J. Am. Coll. Cardiol. 2019;74:567–577. doi: 10.1016/j.jacc.2019.06.007. - DOI - PMC - PubMed
    1. Jaiswal S. Clonal hematopoiesis and nonhematologic disorders. Blood. 2020;136:1606–1614. - PMC - PubMed

Publication types