. 2023 Jan;30(1):54-68.
doi: 10.1038/s41418-022-01045-5. Epub 2022 Jul 23.

N6-Methyladenosine-modified lncRNA LINREP promotes Glioblastoma progression by recruiting the PTBP1/HuR complex

Affiliations

N6-Methyladenosine-modified lncRNA LINREP promotes Glioblastoma progression by recruiting the PTBP1/HuR complex

Xiaoshuai Ji et al. Cell Death Differ. 2023 Jan.

Abstract

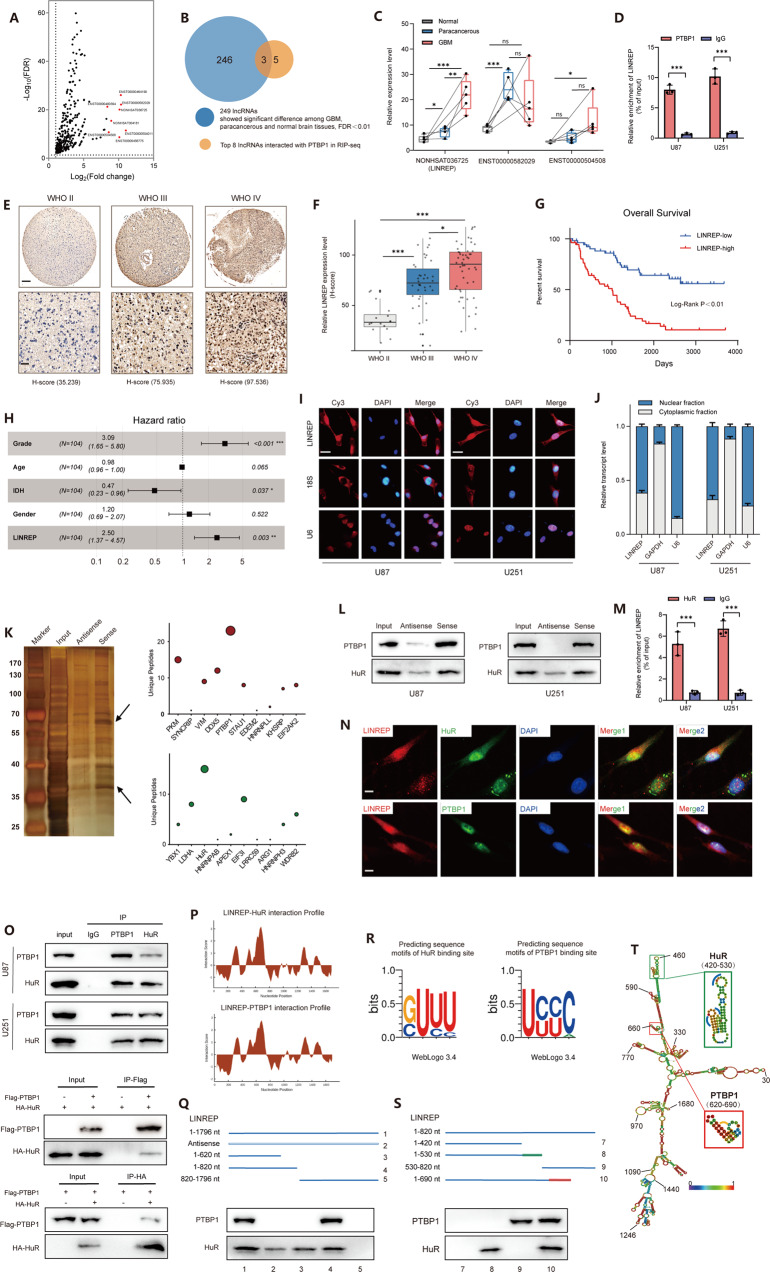
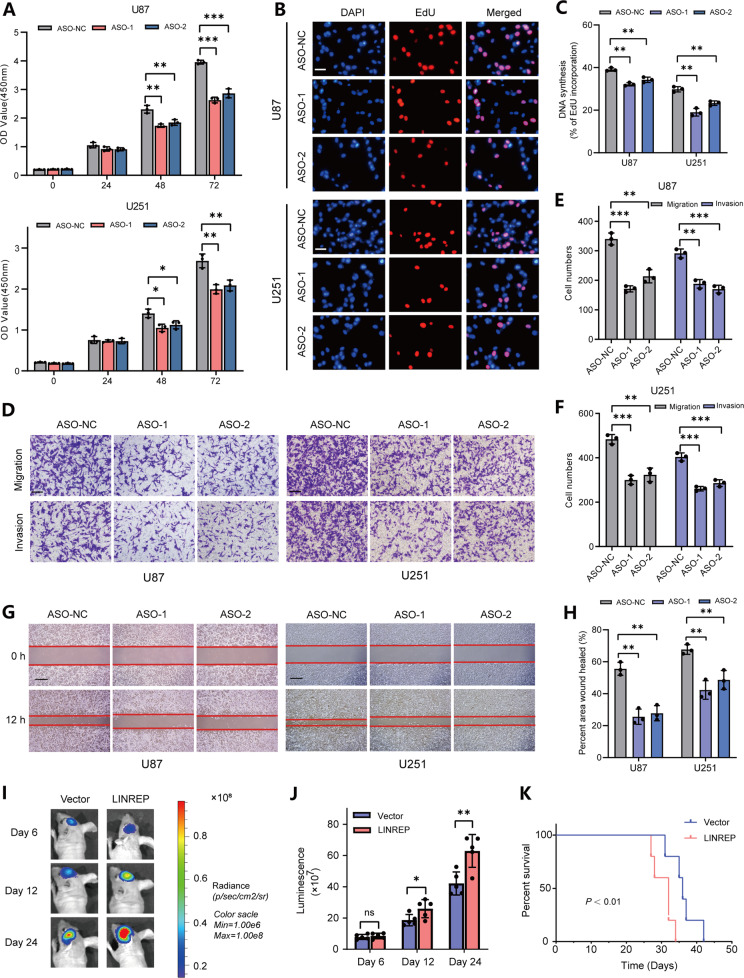
Glioblastoma multiforme (GBM) is acknowledged as the most aggressive primary brain tumor in adults. It is typically characterized by the high heterogeneity which corresponds to extensive genetic mutations and complex alternative splicing (AS) profiles. Known as a major repressive splicing factor in AS, polypyrimidine tract-binding protein 1 (PTBP1) is involved in the exon skipping events of multiple precursor mRNAs (pre-mRNAs) in GBM. However, precise mechanisms that modulate the expression and activity of PTBP1 remain to be elucidated. In present study, we provided evidences for the role of a long intergenic noncoding RNA (LINREP) implicated in the regulation of PTBP1-induced AS. LINREP interacted with PTBP1 and human antigen R (HuR, ELAVL1) protein complex and protected PTBP1 from the ubiquitin-proteasome degradation. Consequently, a broad spectrum of PTBP1-induced spliced variants was generated by exon skipping, especially for the skipping of reticulon 4 (RTN4) exon 3. Interestingly, LINREP also promoted the dissociation of nuclear UPF1 from PTBP1, which increased the binding of PTBP1 to RTN4 transcripts, thus enhancing the skipping of RTN4 exon 3 to some extent. Besides, HuR recruitment was essential for the stabilization of LINREP via a manner dependent on N6-methyladenosine (m6A) formation and identification. Taken together, our results demonstrated the functional significance of LINREP in human GBM for its dual regulation of PTBP1-induced AS and its m6A modification modality, implicating that HuR/LINREP/PTBP1 axis might serve as a potential therapeutic target for GBM.


Conflict of interest statement

The authors declare no competing interests.

Figures

Fig. 1
Fig. 1. Identification and characterization of LINREP in GBM.
A RIP-seq experiments were performed to identify PTBP1-binding lncRNAs. Volcano plot showed the differentially expressed lncRNAs upon PTBP1 immunoprecipitation. Red dots marked top eight upregulated lncRNAs (fold change >2, FDR < 0.01). B Screening strategy was used to find key PTBP1-binding lncRNAs in GBM. C Box-plot analysis of PTBP1-binding lncRNAs in the lncRNA microarrays. D RIP assays were performed in U87 and U251 cells. n = 3 independent experiments, two-tailed Student’s t-test. E, F Representative images (E) and box-plot analysis (F) of RNA-ISH for LINREP expression on WHO grade II–IV glioma tissues. scale bar: 200 μm (top) or 50 μm (bottom). G Kaplan–Meier analysis of overall survival of glioma patients based on LINREP expression (n = 104). H Multivariate analysis for glioma patients using the COX regression model. I, J Identification of LINREP cytoplasmic and nuclear distribution by RNA-FISH (I) and qRT-PCR assays (J). Cy3 dye and DAPI stain, scale bar: 20 μm. *P < 0.05, **P < 0.01, ***P < 0.001. K RNA pulldown assay using LINREP sense and antisense RNAs in U251 cells. L Western blot validation of biotin-labelled antisense and sense LINREP pulldown. M RIP assays were performed in U87 and U251 cells. n = 3 independent experiments, two-tailed Student’s t-test. N Fluorescence assessment of LINREP and HuR or PTBP1 colocalization in U251 cells. Scale bar: 10 μm. O Western blot analysis of co-IP assays were performed on lysates prepared from GBM cells, and HEK293 cells transfected with HA-HuR and Flag-PTBP1. P Interaction profiles of HuR or PTBP1 with LINREP predicted by catRAPID. R POSTAR2 prediction of sequence motifs of HuR or PTBP1 binding sites. Q, R Serial deletions of LINREP were utilized in RNA pulldown assays to identify regions required for the LINREP and HuR or PTBP1 interactions. T The secondary structure of LINREP was predicted by RNAfold. The inset framed in green or red indicated the binding stem-loop structures of HuR or PTBP1 in LINREP, respectively. *P < 0.05, **P < 0.01, ***P < 0.001.
Fig. 2
Fig. 2. LINREP knockdown impaired the proliferation, invasion and migration of GBM cells.
A Quantification of CCK-8 proliferation assays of U87 and U251 cells following LINREP knockdown. B, C Representative images (B) and quantification (C) of EdU assays in U87 and U251 cells after LINREP knockdown. Scale bar: 50 μm. D-F Representative images (D) and quantification (E, F) of transwell invasion and migration assays in U87 and U251 cells after LINREP knockdown. Scale bar: 100 μm. G, H Representative images (G) and quantification (H) of scratch wound healing assays in U87 and U251 cells following LINREP knockdown. Scale bar: 200 μm. Statistical significance was assessed using two-tailed Student’s test. Error bars represented the SD of three independent experiments. I, J Representative bioluminescence images (I) and histogram analysis (J) of Vector or LINREP-overexpressing U87 cells derived xenografts (n = 5). K Kaplan–Meier survival analysis of survival data from the xenografted mice. Log-rank test, P < 0.01. *P < 0.05, **P < 0.01, ***P < 0.001.
Fig. 3
Fig. 3. LINREP was involved in the proteasomal degradation of PTBP1.
A Western blot for HuR and PTBP1 in the LINREP-modified U87 and U251 cells. B Deletion mapping to identify the LINREP binding domain of PTBP1 by RIP-qPCR using Flag-tagged full length or the truncated mutants of PTBP1. n = 3 independent experiments. C, D Western blot of PTBP1 expression in LINREP knockdown (C) or overexpressed (D) U87 and U251 cells after treatment with MG132 (50 μmol/L). E, F Western blot to detect PTBP1 after 0, 4, 8 and 12 h of cycloheximide (100 μg/mL) treatment in LINREP knockdown (E) or overexpressed (F) U87 and U251 cells. G Western blot to detect the ubiquitination of PTBP1 in the LINREP-modified U87 and U251 cells.
Fig. 4
Fig. 4. LINREP modulated AS of RTN4 via interaction with PTBP1.
A The amount of significantly changed AS events in U251 cells with LINREP or PTBP1 knockdown. FDR < 0.05 and IncLevelDifference >0.2 or <−0.2. B The relative fraction of each AS event affected either positively or negatively by LINREP or PTBP1. C Venn diagram of splicing events regulated by LINREP and PTBP1. D Gene annotation and analysis of the common genes alternatively spliced by LINREP and PTBP1. E IGV plot illustrating the exon coverage regulated by LINREP and PTBP1. F qRT-PCR analysis of AS events in each target gene regulated by LINREP or PTBP1. Data was normalized to the control. n = 3 independent experiments, two-tailed Student’s t-test. G Schematic illustration of the RTN4 transcripts showing the exon 3-retained RTN4A and exon 3-skipped RTN4B isoforms. The exon 3 of RTN4 is 2400 bp long. H Box-plot analysis of RTN4A and RTN4B expression (normalized RSEM) in GBM and normal brain tissues by TSVdb. I Schematic diagrams of each exon usage of RTN4 sorted by PTBP1 mRNA expression viewed in GBM by TSVdb. J Western blot for RTN4A and RTN4B in U87 and U251 cells following LINREP knockdown. K, L qRT-PCR (K) and western blot analyses (L) of AS events of RTN4 in LINREP-knockdown U87 and U251 cells following reintroduction of PTBP1. n = 3 independent experiments, two-tailed Student’s t-test. M Correlation between RTN4 exon 3 skipping and LINREP expression in GBM tissues. n = 50, pearson correlation. N Representative images of RNA-ISH and RTN4A IHC staining in GBM tissues. Scale bar: 50 μm. O RIP assay performed using anti-PTBP1 or anti-IgG following LINREP knockdown. IgG served as the negative control. n = 3 independent experiments, two-tailed Student’s t-test. *P < 0.05, **P < 0.01, ***P < 0.001.
Fig. 5
Fig. 5. LINREP regulated the interaction between PTBP1 and UPF1.
A Co-IPs performed using anti-PTBP1 or anti-IgG and analyzed by Coomassie blue staining and mass spectrometry. B Fluorescence assessment of UPF1 and PTBP1 colocalization in U87 cells. Scale bar: 10 μm. C, D Western blot of co-IPs performed on lysates prepared from GBM cells (C), and HEK293 cells (D) transfected with His-UPF1 and Flag-PTBP1. E Western blot analysis of co-IPs performed on lysates prepared from HEK293 cells transfected with His-UPF1 alone or together with Flag-tagged full length or the truncated mutants of PTBP1. F Top, the schematic structures of UPF1 proteins and three His-tagged truncated mutants of UPF1 used in this study. Bottom, western blot analysis of co-IPs performed on lysates prepared from HEK293 cells transfected with Flag-PTBP1 alone or together with His-tagged full length or the truncated mutants of UPF1. G The top 10 biological enrichment analyses of gene ontology in UPF1-knockdown U251 cells. H, J qRT-PCR (H)and western blot (J) analysis of the exon 3 skipping of RTN4 in GBM cells following UPF1 knockdown or upregulation. n = 3 independent experiments, two-tailed Student’s t-test. I IGV plot illustrating the exon 3 coverage of RTN4 regulated by UPF1. K RIP assays performed using anti-PTBP1 or anti-IgG following UPF1 knockdown. IgG served as the negative control. n = 3 independent experiments, two-tailed Student’s t-test. L Western blot analysis of the exon 3 skipping of RTN4 in LINREP-knockdown U87 and U251 cells following depletion of UPF1. M Western blot analysis of co-IPs performed with anti-Flag and lysates derived from HEK293 cells transfected with adding amounts of LINREP, Flag-PTBP1 and His-UPF1. N Western blot analysis of co-IPs performed with anti-PTBP1 and cell lysates prepared from LINREP-modified U251 cells. IgG groups served as the negative controls. *P < 0.05, **P < 0.01, ***P < 0.001.
Fig. 6
Fig. 6. LINREP interacted with PTBP1 to affect the proliferation, invasion and migration of GBM cells.
A Quantification of CCK-8 assays in LINREP-depleted GBM cells following reintroduction of PTBP1. B, C Representative images (B) and quantification (C) of EdU assays in LINREP-depleted U87 and U251 cells following reintroduction of PTBP1. Scale bar: 50 μm. D, E Representative images (D) and quantification (E) of transwell invasion and migration assays in LINREP-depleted U87 and U251 cells following reintroduction of PTBP1. Scale bar: 100 μm. F, G Representative images (F) and quantification (G) of scratch wound healing assays in LINREP-depleted GBM cells following reintroduction of PTBP1. Scale bar: 200 μm. Statistical significance was assessed using two-tailed Student’s test. Error bars represented the SD of 3 independent experiments. H, I Representative bioluminescence images (H) and histogram analysis (I) of either LINREP overexpressed or PTBP1 knockdown U87 cells derived xenografts (n = 5). J Kaplan–Meier survival analysis of survival data from the xenografted mice. Log-rank test, P < 0.01. K Representative images of H&E and IHC staining of PTBP1 and RTN4A expression in xenografts. Scale bars: 50 μm. L, M qRT-PCR (L) and western blot analyses (M) of AS events of RTN4 in LINREP-knockdown U87 and U251 cells following reintroduction of LINREP WT or LINREP ΔPTBP1. n = 3 independent experiments, two-tailed Student’s test. *P < 0.05, **P < 0.01, ***P < 0.001.
Fig. 7
Fig. 7. HuR enhanced LINREP stability via an m6A-dependent manner.
A Box-plot analysis of HuR expression (normalized TPM) in LGG and GBM by GEPIA2. B Western blot for HuR and qRT-PCR analysis of LINREP in U87 and U251 cells following HuR knockdown. C Enrichment of m6A-modified LINREP detected by MeRIP-qPCR assays in U87 and U251 cells. D Western blot for METTL3 and qRT-PCR analysis of LINREP in U87 and U251 cells following METTL3 knockdown. E Western blot for ALKBH5 and qRT-PCR analysis of LINREP in GBM cells following ALKBH5 knockdown. F Enrichment of m6A-modifed LINREP detected by MeRIP-qPCR assays in U87 and U251 cells following METTL3 knockdown. G Half-life of LINREP in METTL3-depleted U87 and U251 cells after treated with actinomycin D (Act D). H Fluorescence assessment of m6A and HuR colocalization in U87 cells. Scale bar: 10 μm. I qRT-PCR analysis of LINREP and HuR in either HuR knockdown or METTL3-enhanced U251 cells. J RIP assays performed using anti-HuR or anti-lgG in U251 cells following METTL3 knockdown. K Schematic representation of the position of m6A motifs within LINREP. L Half-life of LINREP in HEK293 cells transfected with plasmids overexpressing LINREP Δm6A/WT or its m6A site mutations (LINREP Δm6A/741, Δm6A/1185 and Δm6A/1256) after treated with Act D. M Enrichment of m6A-modified LINREP detected by MeRIP-qPCR assays in HEK293 cells transfected with plasmids overexpressing LINREP Δm6A/WT or its m6A sites mutants (LINREP Δm6A/741, Δm6A/1185 and Δm6A/741 + 1185). Statistical significance was assessed using two-tailed Student’s test. Error bars represented the SD of 3 independent experiments. *P < 0.05, **P < 0.01, ***P < 0.001.
Fig. 8
Fig. 8. A schematic model for the mechanisms of LINREP in the development of GBM.
m6A modification induced by METTL3 promoted recruitment of HuR and stability of LINREP expression. LINREP impeded the degradation of PTBP1 from the ubiquitin-proteasome pathway. Thus, the PTBP1-mediated AS events, especially for the exon 3 skipping in RTN4 transcripts were enhanced. Besides, LINREP promoted the dissociation of  UPF1 from PTBP1, which led to the intensified RNA-binding affinity of PTBP1 to RTN4 transcripts. Accordingly, the dual roles of LINREP in the PTBP1-induced AS contributed to the proliferation, migration and invasion of GBM cells.

References

    1. Black D. Mechanisms of alternative pre-messenger RNA splicing. Annu Rev Biochem. 2003;72:291–336. doi: 10.1146/annurev.biochem.72.121801.161720. - DOI - PubMed
    1. Maniatis T, Tasic B. Alternative pre-mRNA splicing and proteome expansion in metazoans. Nature. 2002;418:236–43. doi: 10.1038/418236a. - DOI - PubMed
    1. Xue Y, Zhou Y, Wu T, Zhu T, Ji X, Kwon Y, et al. Genome-wide analysis of PTB-RNA interactions reveals a strategy used by the general splicing repressor to modulate exon inclusion or skipping. Mol cell. 2009;36:996–1006. doi: 10.1016/j.molcel.2009.12.003. - DOI - PMC - PubMed
    1. Bonnal S, López-Oreja I, Valcárcel J. Roles and mechanisms of alternative splicing in cancer - implications for care. Nat Rev Clin Oncol. 2020;17:457–74. doi: 10.1038/s41571-020-0350-x. - DOI - PubMed
    1. Goodall G, Wickramasinghe V. RNA in cancer. Nat Rev Cancer. 2021;21:22–36. doi: 10.1038/s41568-020-00306-0. - DOI - PubMed

Publication types

MeSH terms