. 2022 Jul 23;13(1):4265.
doi: 10.1038/s41467-022-31844-w.

Natural variation of DROT1 confers drought adaptation in upland rice

Affiliations

Natural variation of DROT1 confers drought adaptation in upland rice

Xingming Sun et al. Nat Commun. .

Abstract

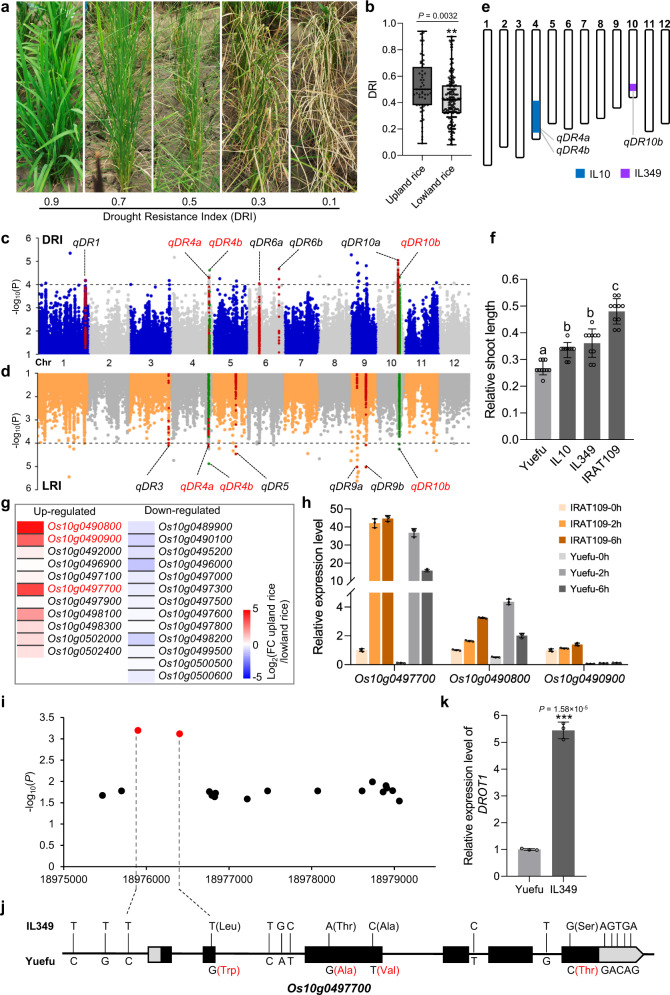
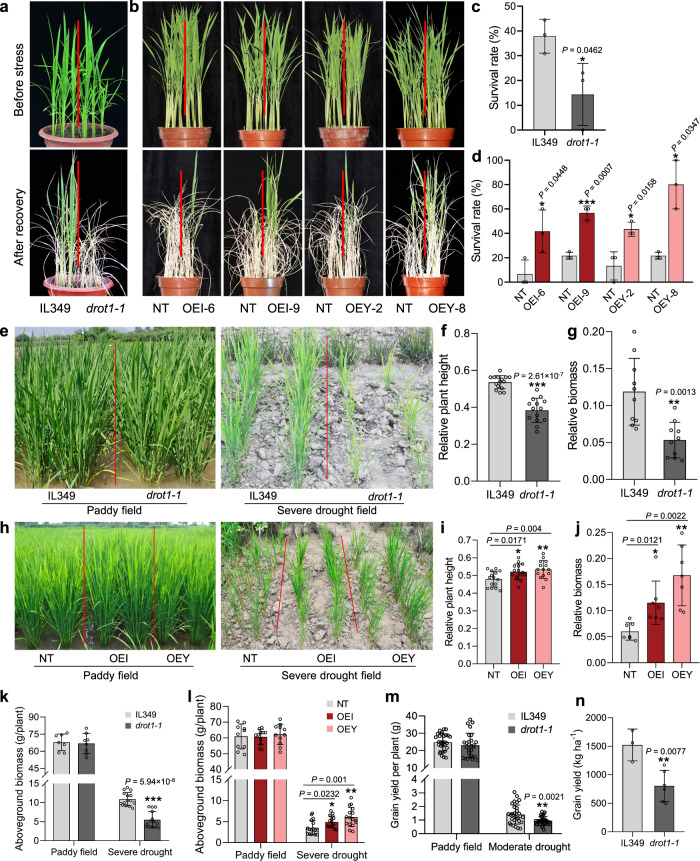
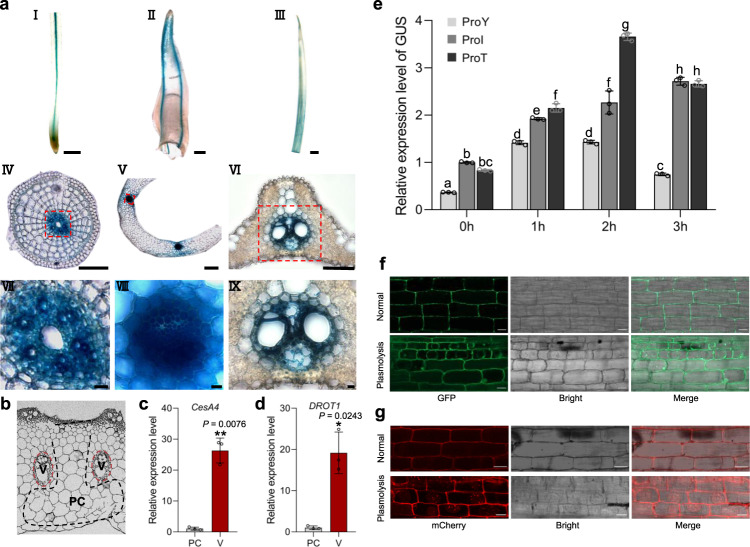
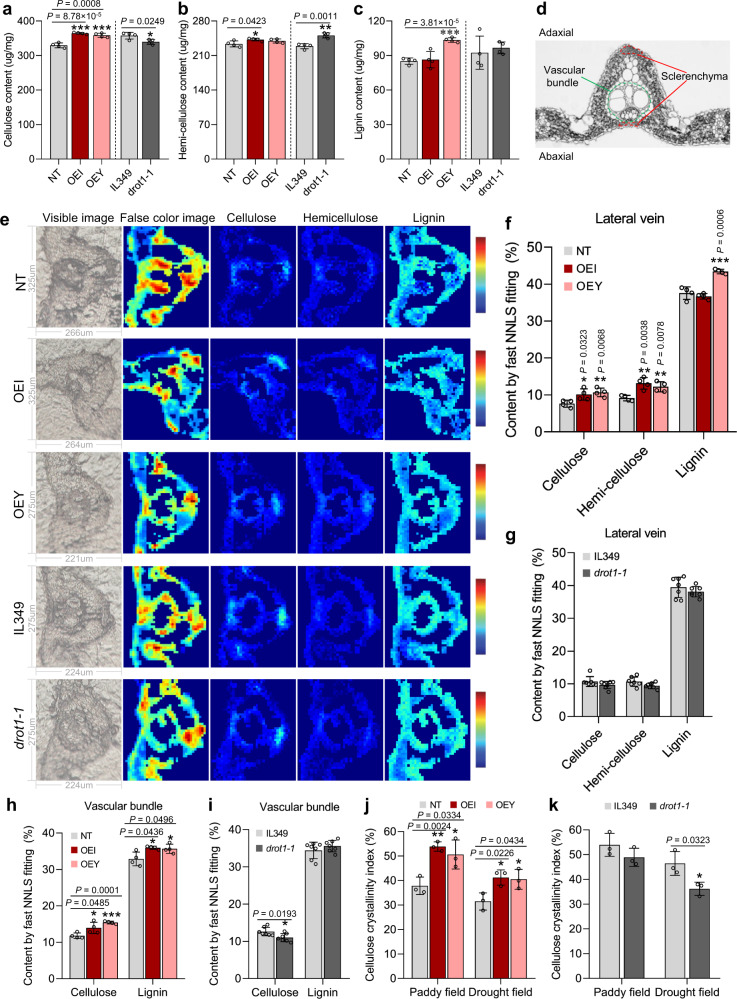
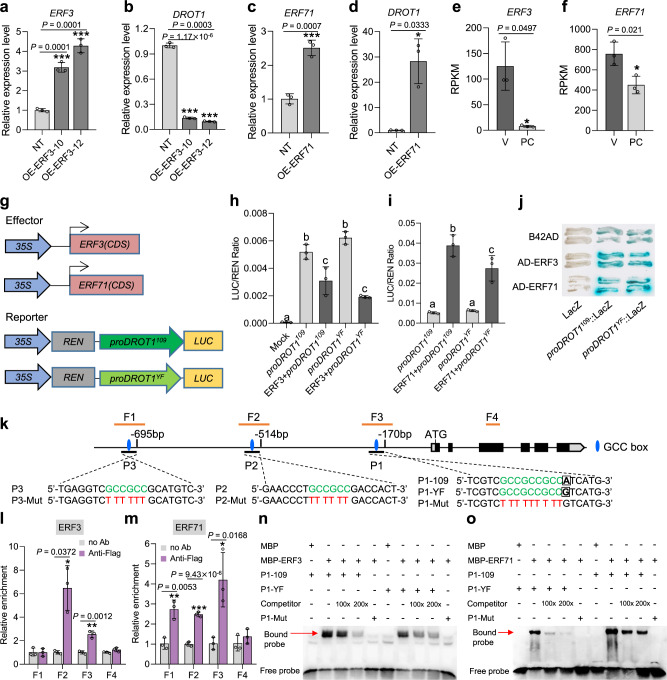
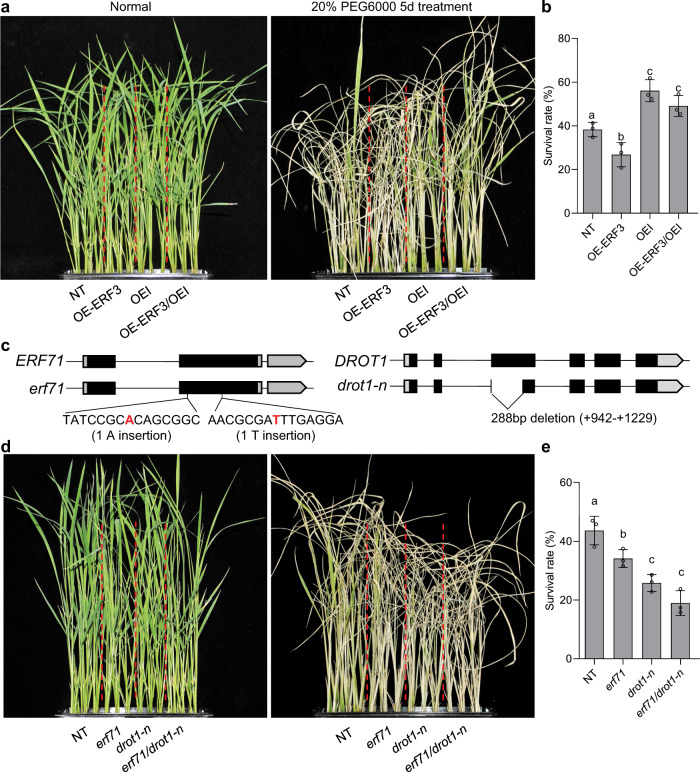
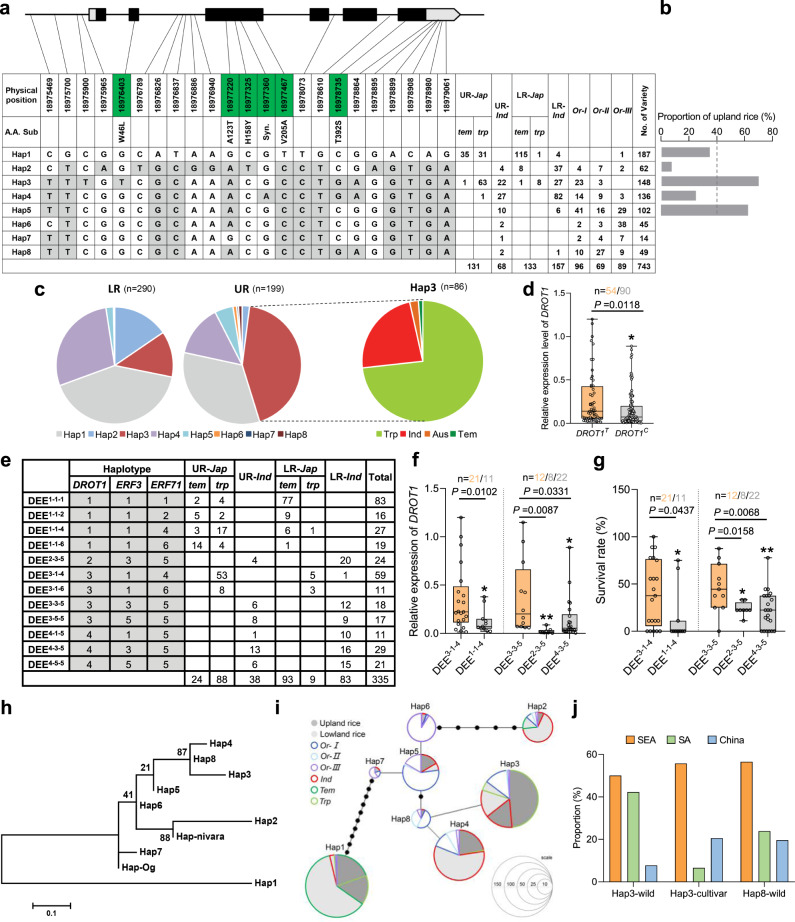
Upland rice is a distinct ecotype that grows in aerobic environments and tolerates drought stress. However, the genetic basis of its drought resistance is unclear. Here, using an integrative approach combining a genome-wide association study with analyses of introgression lines and transcriptomic profiles, we identify a gene, DROUGHT1 (DROT1), encoding a COBRA-like protein that confers drought resistance in rice. DROT1 is specifically expressed in vascular bundles and is directly repressed by ERF3 and activated by ERF71, both drought-responsive transcription factors. DROT1 improves drought resistance by adjusting cell wall structure by increasing cellulose content and maintaining cellulose crystallinity. A C-to-T single-nucleotide variation in the promoter increases DROT1 expression and drought resistance in upland rice. The potential elite haplotype of DROT1 in upland rice could originate in wild rice (O. rufipogon) and may be beneficial for breeding upland rice varieties.


Conflict of interest statement

The protein sequence of DROT1 is the same as OsCOBL4, which has been granted patents in China (Z.L. 2013 1 0322634.4) and the United States (US 10, 190, 133, B2). For patent granted in China, the inventors are Z.L., H.X., P.L., J.L., H.Z. The title of the patent is “Plant drought resistance-related protein OsCOBL4 and its applications”. The invention provided a plant drought tolerance-related protein OsCOBL4 and its encoding gene and application. For patent granted in the United States, the list of inventors is Z.L., H.X., P.L., J.L., H.Z. The title of the patent is “Compositions and methods for improving abiotic stress tolerance”. The invention provided abiotic stress tolerant plants, as well as methods and compositions for identifying, selecting and/or generating abiotic stress tolerant plants. Other authors claim no competing interests.

Figures

Fig. 1
Fig. 1. Dissecting the drought resistance inheritance and cloning of DROT1.
a Phenotypes of accessions corresponding to different DRI. b DRI of upland rice (n = 59 accessions) and lowland rice (n = 212 accessions) subgroups. In each box plot (drawn by GraphPad Prism 8 software), the center line indicates the median, the edges of the box represent the first and third quartiles, and the whiskers extend to span a 1.5 interquartile range from the edges. c, d Manhattan plot of GWAS for DRI (c) and LRI (d). e Chromosome diagram of introgression lines IL349 and IL10. Blank area represents the recipient genome background of Yuefu (lowland rice). Purple rectangle indicates the donor segment of IRAT109 (upland rice) from 18.7 to 19.3 Mb on chromosome 10, and blue rectangle indicates the segment of IRAT109 from 26 to 31 Mb on chromosome 4. Each introgression line contains single segment of IRAT109. f Relative shoot length of seedlings treated with 15% PEG6000 for 10 days. Data represent means ± s.d. (n = 10 plants). g Heat map of 25 up- or down-regulated genes in upland rice compared with lowland rice in the candidate region based on the transcriptome data. FC upland rice/lowland rice represents the average expression value of two upland rice divided by that of two lowland rice. h Dehydration stress induced expression of genes in IRAT109 and Yuefu. Two-week-old seedlings were dehydrated under room condition for 0, 2 and 6 h. Data represent means ± s.d. (n = 3 biological replicates). i Association analysis of genetic variation in Os10g0497700 with DRI. Red dots indicate the most significant SNPs. j Allelic variation of Os10g0497700 between IL349 and Yuefu. k Expression of DROT1 in IL349 and Yuefu detected in leaf tissues of two-week-old seedlings grown under normal conditions. Data represent means ± s.d (n = 3 biological replicates). In b, k, significant differences were determined by two-tailed Student’s t-tests (**P < 0.01, ***P < 0.001). In f, different letters indicate significant differences (P = 0.01, one-way ANOVA). Source data are provided as a Source Data file.
Fig. 2
Fig. 2. Functional validation of DROT1 in drought resistance.
a Drought resistance of drot1-1 compared to IL349. b Drought resistance of DROT1-overexpressing transgenic lines compared to NT (negative transgenic control). The seedlings grown for 4 weeks under normal conditions (top in a, b) were treated by drought stress for 15 days, followed by re-watering for 10 days (bottom in a, b). c Survival rates of IL349 and drot1-1 seedlings after re-watering. Data represent means ± s.d. (n = 3 biological replicates). d Survival rates of NT, OEI and OEY seedlings after re-watering. Data represent means ± s.d. (n = 3 biological replicates). e Growth performance of drot1-1 and IL349 grown in paddy field and severe drought field for 90 days. f Relative plant height of drot1-1 and IL349. Data represent means ± s.d. (n = 15/14 plants). g Relative aboveground biomass of drot1-1 and IL349. Data represent means ± s.d. (n = 10 plants). h Growth performance of NT and OE lines grown in paddy field and drought field for 90 days. i Relative plant height of NT, OEI and OEY. Data represent means ± s.d. (n = 15 plants). The values of relative plant height (f, i) were calculated by plant height in severe drought field divided by those in paddy field. j Relative aboveground biomass of NT, OEI and OEY. Data represent means ± s.d. (n = 7 plants). The values of relative biomass (g, j) were calculated by plant biomass in severe drought field divided by those in paddy field. k Aboveground biomass of drot1-1 and IL349 at mature stage. Data represent means ± s.d. (n = 7/8, 15/14 plants). l Aboveground biomass of NT, OEI and OEY at mature stage. Data represent means ± s.d. (n = 10/11/11, 17/14/16 plants). m Grain yield per plant of drot1-1 and IL349 under paddy field and moderate drought field. Data represent means ± s.d. (n = 29/27, 30/30 plants). n Grain yield per hectare of drot1-1 and IL349 under moderate drought field. Data represent means ± s.d. (n = 3/6 plots). Asterisks indicate statistical significance by two-tailed Student’s t-tests (*P < 0.05, **P < 0.01, ***P < 0.001). Source data are provided as a Source Data file.
Fig. 3
Fig. 3. Expression patterns of DROT1 and its subcellular localization.
a GUS staining. (I) Root. (II) Coleoptile. (III) leaf of seedling. (IV, V, and VI) Cross-sections of I, II and III separately. (VII, VIII, and IX) Magnification of the region framed by red box in IV, V, and VI, respectively. Scale bar, 500 μm in I-III, 200 μm in IV-VI, 20 μm in VII–IX. n = 5 biological replicates. b Schematic diagram of parenchyma cells (PC, indicated by black dashed line) and vascular bundles (V, indicated by red dashed line) in the cross-sections of rice internodes for microdissection. c, d qRT-PCR analysis of the vascular bundle-specific marker gene CesA4 (c) and DROT1 (d) in harvested cells or tissues as indicated in b. Data are means ± s.d. (n = 3 biological replicates). Asterisks indicate statistical significance by two-tailed Student’s t-tests (*P < 0.05, **P < 0.01). e Expression of GUS gene promoted by different types of DROT1 cis-elements. Three vectors containing GUS reporter gene driven by the promoter ProY (the promoter of DROT1 from Yuefu), ProI (the promoter of DROT1 from IRAT109) or ProT (the promoter of DROT1 from Yuefu with the SNP s18975900 changed from C to T) were introduced into Nipponbare, respectively. Data are means ± s.d. (n = 3 biological replicates). Different letters indicate statistically significant differences at P = 0.01 by one-way ANOVA. f, g Subcellular localization of DROT1. Seedlings root tissues of transgenic rice containing vector proDROT1::DROT1-GFP (f) or proDROT1::DROT1-mCherry (g) were observed by confocal laser-scanning microscopy, respectively. n = 3 independent experiments. The plasmolysis in the cells occurred by treated root tissues with 1 M sorbitol for 15 min. Bars = 20 μm. Source data are provided as a Source Data file.
Fig. 4
Fig. 4. DROT1 affects cell wall properties under drought stress condition.
ac Quantification of cell wall components of rice plants by chemical analysis. The contents of cellulose (a), hemi-cellulose (b), and lignin (c) obtained from leaf tissues of the indicated plants grown in drought field. Data are means ± s.d. (n = 4 biological replicates). d Microstructural diagram of cross section of lateral vein in rice leaf. Green-circled area represents vascular bundle, red-circled area represents sclerenchyma. e Fast NNLS fitting images of lateral veins in cross section of leaves grown in drought field. From left to right are visible images, false color images (reflecting the location and density of spectral distribution in the range of 1800−800 cm−1 throughout the lateral vein, comparisons cannot be made between different rice plants vertically), spectrogram of characterized cellulose, hemi-cellulose and lignin content. The colors of these three columns reflects the relative content of each target component. In this arrangement, comparisons can be made between various components horizontally as well as between different plants vertically. fi Semi-quantitative analysis of cell wall components. The contents of cellulose, hemi-cellulose and lignin determined by fast NNLS fitting for lateral veins of e (f, g). The cellulose and lignin content based on fast NNLS fitting for the segmented vascular bundle from e (h, i). Data are means ± s.d. (n = 4 biological replicates for f, h, and n = 7 biological replicates for g, i). j, k Relative crystallinity index (RCI) of cellulose in leaf samples of NT, OEI and OEY (j), drot1-1 and IL349 (k) from paddy field and drought field, respectively. It is presented as percentage of crystalline in total cell wall components. Data are means ± s.d. (n = 3 biological replicates). Asterisks indicate statistical significance by two-tailed Student’s t-tests (*P < 0.05, **P < 0.01, ***P < 0.001). Source data are provided as a Source Data file.
Fig. 5
Fig. 5. DROT1 is directly regulated by ERF3 and ERF71.
a, b Expression of ERF3 (a) and DROT1 (b) in ERF3-overexpressing transgenic lines compared with that in NT (negative transgenic control with Nipponbare background). Data are means ± s.d. (n = 3 biological replicates). c, d Expression of ERF71 (c) and DROT1 (d) in ERF71-overexpressing transgenic lines compared with that in NT. Data are means ± s.d. (n = 3 biological replicates). e, f The differentiated expression of ERF3 (e) and ERF71 (f) in vascular bundles and parenchyma cells. Data are means ± s.d. (n = 3 biological replicates). gi Transient expression assays of dual-luciferase by co-transfecting rice protoplasts with the vectors shown in g. The transcription activities of the reporters were significantly repressed by ERF3 (h), but were strikingly activated by ERF71 with a higher activation activity for the promoter of DROT1 from IRAT109 (i). Mock, co-transfected with an empty reporter construct and an empty effector construct. proDROT1109/ proDROT1YF, co-transfected with a reporter construct and an empty effector construct. 109, IRAT109; YF, Yuefu. Data are means ± s.d. (n = 3 biological replicates). Different letters indicate statistically significant differences at P = 0.01 by one-way ANOVA test. j Y1H assay. ERF3 and ERF71 can bind to the promoter of DROT1. n = 3 independent experiments. k Schematic diagram showing the three GCC box regions used for EMSA in the promoter of DROT1, namely P1, P2 and P3. Green letters in the three probe sequences indicate the core motif of GCC box, red letters indicate the substituted nucleotide sequences in the mutated probes. Black boxes indicate the functional SNP s18975900. F1-F4 are the four fragments used in ChIP-qPCR. l, m ChIP-qPCR analysis of ERF3 (l) and ERF71 (m) enrichment of fragments in the promoter of DROT1. Amplified fragments by qPCR are marked with F1-F4 in k. Values are means ± s.d. (n  =  3 biological repeats). n, o EMSA shows ERF3 and ERF71 directly bind to the GCC box of P1 in the promoter of DROT1. Unlabeled wild type probes were used as competitors. n = 4 independent experiments. Asterisks indicate statistical significance by two-tailed Student’s t-tests (*P < 0.05, **P < 0.01, ***P < 0.001). Source data are provided as a Source Data file.
Fig. 6
Fig. 6. DROT1 genetically interacts with ERF3 and ERF71 to regulate drought resistance.
a, b Resistance of NT, OE-ERF3, OEI, and OE-ERF3/OEI plants to drought stress simulated by 20% PEG6000. Seedlings grown for 2 weeks under normal conditions (a, left) were treated by 20% PEG for 5 days, followed by re-watering for 7 days (a, right). Statistical analysis of seedling survival rates after re-watering (b). Data are means ± s.d. (n = 3 biological replicates). c Diagram of ERF71 and DROT1 knockout lines. d, e Resistance of NT, erf71, drot1-n, and erf71/drot1-n double mutant plants to drought stress simulated by 20% PEG6000. Data are means ± s.d. (n = 3 biological replicates). Different letters indicate statistically significant differences at P = 0.05 by one-way ANOVA with Duncan test. Source data are provided as a Source Data file.
Fig. 7
Fig. 7. Haplotype analysis and origin of DROT1.
a Haplotypes of DROT1 in natural population. Nucleotide variations in the coding region are labeled in green boxes. The DROT1 nucleotide sequences of accessions in the germplasm were compared with that of Nipponbare (Hap1). The number of varieties for each haplotype (Hap1–8) is shown in the right column. The upland rice IRAT109 belongs to Hap3, and the lowland rice Yuefu shares same haplotype with Nipponbare. UR, upland rice. LR, lowland rice. b Proportion of upland rice in cultivated accessions with Hap1-Hap5. The dashed line represents the average proportion of upland rice in the entire cultivar population. c Distribution of DROT1 haplotypes in lowland rice and upland rice. d Relative expression of DROT1 in DROT1T and DROT1C type accessions under drought stress. DROT1T indicates the accessions with Hap3 as the SNP site s18975900 is “T”; DROT1C indicates the accessions with s18975900 is “C” (non-Hap3 haplotype). Data are means ± s.d. (n = 3 biological replicates). e Combined haplotypes of DROT1-ERF3-ERF71. f Relative expression of DROT1 in accessions with same haplotype of ERF3 and ERF71. Data are means ± s.d. (n = 3 biological replicates). g Survival rates of accessions with same haplotype of ERF3 and ERF71. Data are means ± s.d. (n = 3 biological replicates). In each box plot of d, f, and g, the center line indicates the median, the edges of the box represent the first and third quartiles, and the whiskers extend to span a 1.5 interquartile range from the edges. h Evolutionary relationship of eight haplotypes. O.nivara and O.glaberrima-specific haplotypes were used as outgroups. The scale bar indicates the average number of substitutions per site for different haplotypes. i Haplotype network of DROT1 shown by the minimum-spanning tree. Circle size is proportioned to the number of accessions with a given haplotype. Circle colors represent different rice subspecies. The dark gray inside the circle indicates upland rice, while the light gray indicates lowland rice. j Geographical distribution of rice accessions with Hap3 and Hap8. SEA, South East Asia. SA, South Asia. Statistical significance was calculated by two-tailed Student’s t-test and P-values were indicated in d, f, and g (*P < 0.05, **P < 0.01). Source data are provided as a Source Data file.

References

    1. Gupta A, Rico-Medina A, Caño-Delgado A. The physiology of plant responses to drought. Science. 2020;368:266–269. doi: 10.1126/science.aaz7614. - DOI - PubMed
    1. Zhang Q. Strategies for developing Green Super Rice. Proc. Natl Acad. Sci. USA. 2007;104:16402–16409. doi: 10.1073/pnas.0708013104. - DOI - PMC - PubMed
    1. Xia H, et al. Bi-directional selection in upland rice leads to its adaptive differentiation from lowland rice in drought resistance and productivity. Mol. Plant. 2019;12:170–184. doi: 10.1016/j.molp.2018.12.011. - DOI - PubMed
    1. Dixit S, et al. Multiple major QTL lead to stable yield performance of rice cultivars across varying drought intensities. BMC Genet. 2014;15:16. doi: 10.1186/1471-2156-15-16. - DOI - PMC - PubMed
    1. Kim T, et al. Drought-tolerant QTL qVDT11 leads to stable tiller formation under drought stress conditions in rice. Plant Sci. 2017;256:131–138. doi: 10.1016/j.plantsci.2016.11.008. - DOI - PubMed

Publication types