. 2022 Aug 12;50(14):7938-7958.
doi: 10.1093/nar/gkac613.

HDAC1 and PRC2 mediate combinatorial control in SPI1/PU.1-dependent gene repression in murine erythroleukaemia

Affiliations

HDAC1 and PRC2 mediate combinatorial control in SPI1/PU.1-dependent gene repression in murine erythroleukaemia

Sebastian Gregoricchio et al. Nucleic Acids Res. .

Abstract

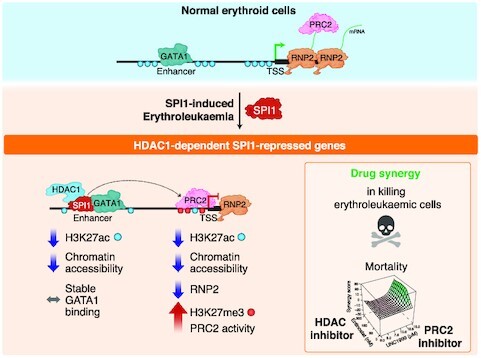
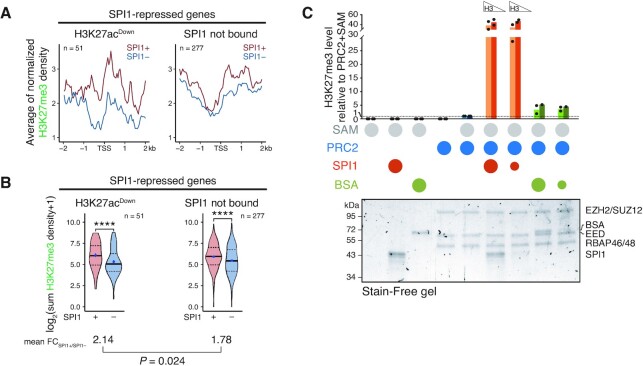
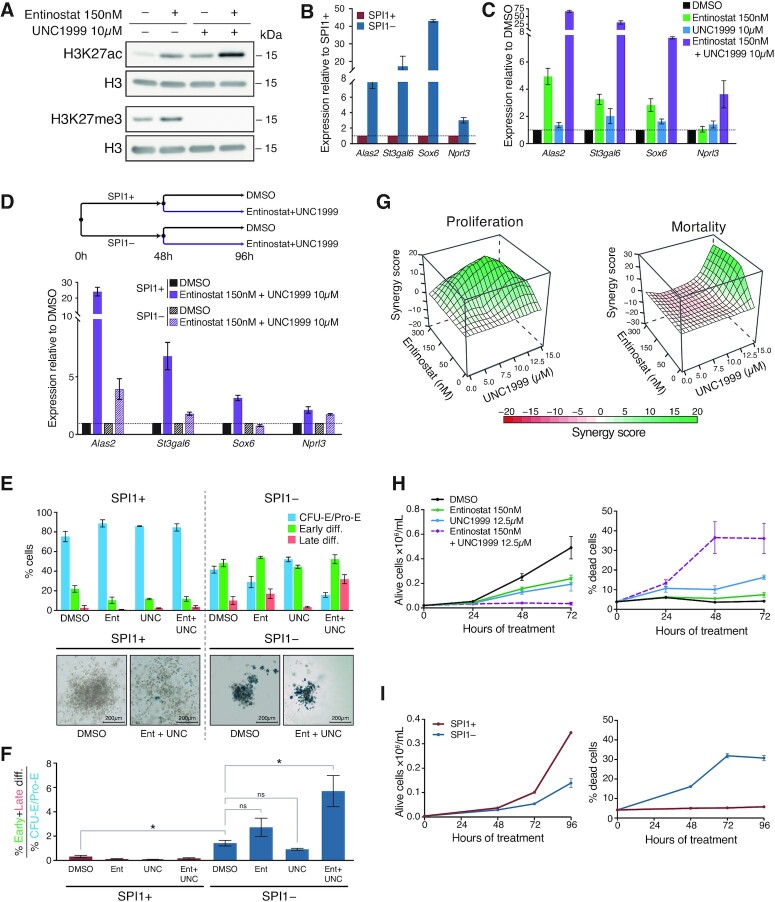
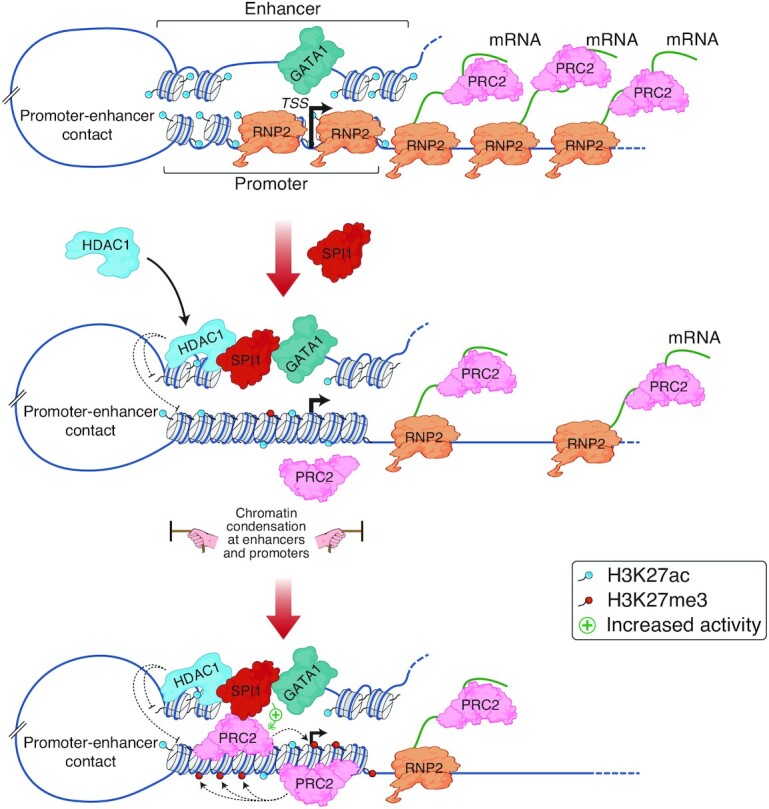
Although originally described as transcriptional activator, SPI1/PU.1, a major player in haematopoiesis whose alterations are associated with haematological malignancies, has the ability to repress transcription. Here, we investigated the mechanisms underlying gene repression in the erythroid lineage, in which SPI1 exerts an oncogenic function by blocking differentiation. We show that SPI1 represses genes by binding active enhancers that are located in intergenic or gene body regions. HDAC1 acts as a cooperative mediator of SPI1-induced transcriptional repression by deacetylating SPI1-bound enhancers in a subset of genes, including those involved in erythroid differentiation. Enhancer deacetylation impacts on promoter acetylation, chromatin accessibility and RNA pol II occupancy. In addition to the activities of HDAC1, polycomb repressive complex 2 (PRC2) reinforces gene repression by depositing H3K27me3 at promoter sequences when SPI1 is located at enhancer sequences. Moreover, our study identified a synergistic relationship between PRC2 and HDAC1 complexes in mediating the transcriptional repression activity of SPI1, ultimately inducing synergistic adverse effects on leukaemic cell survival. Our results highlight the importance of the mechanism underlying transcriptional repression in leukemic cells, involving complex functional connections between SPI1 and the epigenetic regulators PRC2 and HDAC1.


Figures

Graphical Abstract
Graphical Abstract
Abnormal high SPI1 expression leads to HDAC1-mediated transcriptional repression by deacetylating SPI1-bound enhancers that are GATA1 targets in erythropoiesis. PRC2 and HDAC1 synergize to mediate SPI1 repressive activity that enables leukaemic cell survival and expansion.
Figure 1.
Figure 1.
SPI1 represses gene transcription by binding to active enhancers in leukaemic cells. (A) SPI1 expression was determined by immunoblotting of lysates of leukaemic cells (#763) treated for 48 or 72 h with or without doxycycline (dox) to induce the expression of Spi1 shRNA. HSC70 was used as loading control. (B) Heatmap of SPI1-normalized ChIP-seq reads performed in leukaemic cells treated (SPI1) or not (SPI1+) with dox for 48 h, sorted according to the decreasing signal intensity in SPI1+ cells. (C) SPI1 ChIP-seq data were crossed with RNA-seq data to identify the percentage of genes that are bound by SPI1 among activated (gene expression relative to SPI1 cells ≥1.5, P < 0.05), repressed (gene expression relative to SPI1 cells ≤ 0.67, P < 0.05), or NoResp (0.9 ≤ gene expression relative to SPI1 cells ≤ 1.1, P ≥ 0.05) genes. (DE) Top 10 enriched biological processes identified by DAVID functional analysis (P < 0.05) and ranked by P-value (red scale) using repressed (D) or activated (E) genes that are bound (upper panel) or not (lower panel) by SPI1. Gray scale indicates the relative enrichment of a corresponding biological process. (F) Enrichment of transcriptional categories in each genomic region compared to the total number of SPI1-bound genes in the indicated genomic region for repressed or NoResp genes using Fisher's test. * P < 0.05, ** P < 0.01. (G) UpSet plot representing the number of genes with SPI1 peaks at single or multiple genomic regions as indicated by the black dots. Horizontal stack plots show the number of genes with one peak in a specific region that are associated with additional peaks in other genomic regions. (H) Doughnut chart showing the percentage of active enhancers (with H3K27ac and H3K4me1 marks), inactive enhancers (only H3K4me1 mark) or Not enhancers (without H3K27ac or H3K4me1 marks) at SPI1-bound intergenic and gene body regions of SPI1-repressed genes. (I) Top: Alas2 genomic locus with SPI1, H3K27ac, H3K4me1 ChIP-seq tracks, the sgRNA target site (scissors and gray bar) and putative SPI1-binding DNA sequences at Alas2 enhancer of Control (Ctrl) and mutant clones. PAM: Protospacer Adjacent Motif. Bottom-left: SPI1 ChIP-qPCR in the controls (Ctrl1 and 2) and 2 clones (MC2 and MC8) deleted for the SPI1 binding site at Alas2 enhancer. Ah1 enhancer site is an untargeted positive control bound by SPI1. Mean % Input ± SEM of 4 independent experiments is shown. Bottom-right: RT-qPCR analysis of the Alas2 and Spi1 transcript expression in the two controls and two independent clones. Data represent the mean ± SEM of expression relative to Ctrl1 normalized to Hprt1 and Polr2a gene expression of three independent experiments. * P < 0.05, *** P < 0.001, ns: not significant, two-tailed Student's t-test.
Figure 2.
Figure 2.
SPI1 interacts with HDAC1 to repress gene expression. (A) Protein lysates were immunoprecipitated (IP) with antibodies against HDAC1, SIN3A and IgG (negative control) and immunoblotted with antibodies against SIN3A, HDAC1, SPI1 and HSP90β (negative control). The membrane of the input samples was cut for ECL detection, as indicated by the vertical bar. (B) ChIP performed using SPI1 antibody was immunoblotted with antibodies against HDAC1, SPI1 and STAT3 (negative control). The HDAC1 input signal was from a lower exposure than IP, as indicated by the vertical bar. (C) Leukaemic cells were treated for 48 h with or without dox and for additional 6 h with HDAC1/3 inhibitor (Entinostat, 3 μM) or DMSO. Whole-cell extracts were analyzed by immunoblotting with antibodies against HDAC1, SPI1, H3K27ac and H4 (loading control). (D, I) Venn diagram showing the overlapping genes bound by SPI1 at enhancers that are repressed (D) or activated (I) by SPI1 (blue) or by HDAC1 (green). RNA expression was measured by RNA-seq (3 independent experiments). (E, F) Full (•) and empty (○) circles indicate the presence or absence (dox treatment), respectively, of SPI1 expression or HDAC1/3 activity (Entinostat treatment). (E) Violin plots showing the distribution of changes in mRNA expression by SPI1 depletion (○) in the presence of normal HDAC1/3 activity (blue) or in the absence of HDAC1/3 activity (purple) of the genes repressed and bound by SPI1 at enhancers. (F) Violin plots showing the distribution of changes in mRNA expression by HDAC1/3 inhibition (○) in the presence of SPI1 overexpression (green) or in the absence of SPI1 (violet) of the genes repressed and bound by SPI1 at enhancers. (G) Mean of relative expression ± SEM of RNA-seq of three experiments for the same comparison as those described in (E and F) illustrated for four SPI1-repressed genes bound at enhancers. (H) Violin plots showing the distribution of changes in mRNA expression by SPI1 depletion (blue) or by HDAC1/3 inhibition (green) of the genes activated and bound by SPI1 at enhancers.
Figure 3.
Figure 3.
SPI1 represses gene expression by decreasing H3K27 acetylation at SPI1-bound enhancers that are targets of HDAC1. (A and B) Density plot profiles of H3K27ac signals in SPI1+ (untreated, red) or SPI1 (54 h dox treated, blue) cells for SPI1-repressed genes centered on SPI1 peak summits at active or inactive enhancers (A) or in two separated subgroups of genes according to H3K27ac signal in dox untreated relative to dox treated cells at enhancers bound by SPI1. (B) Profiles of H3K27ac signal at H3K27acDown or H3K27acNotDown enhancers bound by SPI1 and at the TSS of the same genes are shown as illustrated. n = number of SPI1 peaks or of TSSs. (C) Density plot profiles of H3K27ac normalized signal in untreated (DMSO, red) or Entinostat-treated (for 6 h at 3 μM, green) cells for SPI1-repressed genes whose enhancers are bound by SPI1. Profiles are centered on SPI1 peak summits at enhancers or at the TSS for the same groups of genes as in (B). (D) The H3K27ac, H3K4me1 and SPI1 binding patterns are shown at the St3gal6 and Alas2 loci for SPI1+ or SPI1 and untreated (DMSO) or Entinostat-treated cells. Sites of SPI1 binding at enhancers and around TSSs of the same genes are highlighted in yellow. Representative results from one experiment. (E) SIN3A (ChIP) in MEL cells (56), the HDAC1 signal profile (CUT&Tag) and the SPI1 binding pattern in TgSpi1 erythroleukaemic cells are shown at the St3gal6 and Alas2 loci. Sites of SPI1 binding at enhancers and TSSs are highlighted in yellow.
Figure 4.
Figure 4.
SPI1 reduces chromatin opening and RNA pol II occupancy at the TSS without impacting GATA1 accessibility to chromatin. (A) Density plot profiles of ATAC signals in SPI1+ (untreated, red) or SPI1 (54 h dox treated, blue) cells for SPI1-repressed genes bound at H3K27acDown or H3K27acNotDown enhancers. Profiles of ATAC signal are centered on SPI1 peak summits at bound enhancers or at the TSS of the same genes. (B) Differences between SPI1 and SPI1+ cells of ATAC signals within regions ±1 kb from the SPI1 peak summit at active enhancers or within regions ±1 kb from the TSS of the same genes. The dots represent the signal difference value over each SPI1 peak at enhancers or each TSS. Blue and red dots represent ATAC signal intensities higher or lower in SPI1 cells, respectively. (C) The H3K27ac, H3K4me1 and SPI1 binding patterns for SPI1+ cells and ATAC signal for SPI1+ and SPI1 cells are shown at the St3gal6 and Alas2 loci. Representative results of one experiment. (D) Density plot profiles of RNA pol II signals in SPI1+ or SPI1 cells for SPI1-repressed genes bound at H3K27acDown or H3K27acNotDown enhancers or for SPI1-activated genes whose enhancers are bound by SPI1. Profiles of ATAC signal are centered on SPI1 peak summits at enhancers or on TSSs of the same genes. (E) Density plot profiles of ATAC signals in SPI1+ or SPI1 cells for SPI1-activated genes whose enhancers are bound by SPI1. Profiles are centered on SPI1 peak summits at bound enhancers or on TSS of the same genes. (F) Top 25 motifs obtained by motif enrichment analysis at ±150 bp from the SPI1 peak summit position at H3K27acDown or H3K27acNotDown enhancers for repressed genes or at active enhancers bound by SPI1 for activated genes. Transcription factor motifs are ranked by increasing adjusted P-value. Only motives corresponding to expressed genes in leukaemic cells are labelled. (G) Density plot profiles of ATAC signal in SPI1+ or SPI1 cells at H3K27acDown enhancers co-bound by SPI1 and GATA1 for repressed genes. Profiles are centered on SPI1 peak summits at bound enhancers or on TSS of the same genes
Figure 5.
Figure 5.
Occupancy of SPI1 at deacetylated enhancers is associated with increased H3K27me3 around the TSS of the SPI1 repressed genes. (A) Density plot profiles of H3K27me3 signals in SPI1+ (untreated) or SPI1 (54 h dox treated) cells centered on the TSS of SPI1-repressed genes with H3K27acDown SPI1-bound enhancers or not bound by SPI1. (B) Distribution of the sums of H3K27me3 signals within region ±1 kb from TSS for the same genes and groups than in (A). Means of the differential ratio of H3K27me3 signal between SPI1+ and SPI1 cells are indicated for each group by the black lane. ****P < 0.0001, Wilcoxon test. (C) PRC2 in vitro activity assays using 500 ng (light bars) or 250 ng (dark bars) of H3.1 mixed with the PRC2 complex and SPI1 or BSA (negative control) at a molar ratio of 1:1 (large circles) or 1:5 (small circles). Circles in the legend indicate the proteins or substrate added to the mix. S-Adenosyl methionine (SAM) was the PRC2 substrate. H3K27me3 was quantified by dot blot experiments (Supplementary Figure S10E) and normalized to the activity of PRC2 with SAM (fifth group of bars). Protein mixes were separated on Stain-Free polyacrylamide gradient gels detected upon activation by UV light (λ = 302 nm) as shown in the lower panel. The identity of the proteins was validated by immunoblotting (Supplementary Figure S10D).
Figure 6.
Figure 6.
PRC2 functionally cooperates with HDAC1 to maintain gene repression, erythroid differentiation blockage and erythroid blast survival. (A) Leukaemic cells were treated with Entinostat (150 nM) or UNC1999 (10 μM), or both, for 48 h. Whole-cell extracts were analysed by immunoblotting with antibodies against H3K27ac, H3K27me3 and H3 (loading control). (B) Expression of SPI1 repressed genes was quantified by RT-qPCR in untreated leukaemic cells (SPI1+, red) or dox treated (SPI1, blue) for 48 h. Data represent the mean ± SEM of expression relative to untreated cells normalized to PolR2a mRNA (three independent experiments). (C) Expression of SPI1 repressed genes was quantified by RT-qPCR in leukaemic cells treated with DMSO (control, black), Entinostat 150 nM (green), UNC1999 10 μM (blue) or both inhibitors (purple) for 48 h. Data represent the mean ± SEM of expression relative to DMSO-treated cells normalized to PolR2a mRNA (three independent experiments). (D) Schematic diagram of the treatment of cells whose expression of SPI1 repressed genes was quantified by RT-qPCR at the end of the 96 h of treatment. Data represent the mean ± SEM of expression relative to DMSO of SPI1+ or SPI1cells and normalized to PolR2a mRNA (three independent experiments). (E) Upper panel: Leukaemic cells were treated or not with dox (SPI1 or SPI1+ cells) concomitantly with DMSO or Entinostat 150 nM or UNC1999 10 μM or the combination of both inhibitors for 5 days in cells. Expression of CD71 and the level of forward scattering (FSC-A) analyzed by flow cytometry is shown. Three distinct population were defined: CFU-E/Pro-E (FSC-AhighCD71high, blue), early differentiation (FSC-AlowCD71high/medium, green), late differentiation (FSC-AlowCD71low, red) as shown in Supplementary Figure S11B. Means ± SEM of the percentage of each population for three independent experiments are indicated. Lower panel: Benzidine staining of representative colonies grown in methylcellulose with or without dox (SPI1 or SPI1+ cells) and with DMSO or Entinostat + UNC1999 for 5 days. (F) Differentiation state described in (E) are presented as the ratio of the percentage of early and late differentiated cells relative to CFU-E/Pro-E. Mean of the ratios were compared by a Wilcoxon test. *P < 0.05, ns = not significant. (G) Cells were treated for 48 h with different concentrations of Entinostat with or without UNC1999. The synergy score calculated by the ZIP method on the number of live cells or percentage of dead cells is represented by a 3D surface heatmap. Green, significant synergy; red, significant antagonism; white, additivity. (H) Cells were treated with DMSO (control), Entinostat 150 nM, UNC1999 12.5 μM or the combination of both inhibitors for the indicated hours. Mean ± SEM of the number of live cells and percentage of dead cells measured by DAPI exclusion assay (Three independent experiments). (I) Cells were treated (SPI1) or not (SPI1+) with dox for the indicated hours. Mean ± SEM of the number of live cells and percentage of dead cells measured by DAPI exclusion assay (Three independent experiments).
Figure 7.
Figure 7.
Model of SPI1-mediated gene repression in murine erythroleukaemia. Working hypothesis representing one of the mechanisms of gene repression by SPI1 based on the data described in this manuscript. During normal erythroid differentiation, GATA1 binds active enhancers and induces erythroid gene expression; SPI1 is barely expressed in CFU-E. When SPI1 is highly expressed, it binds to SPI1 binding sites at enhancers and, by interacting with HDAC1, triggers HDAC1-mediated deacetylation of enhancers and associated gene promoters. Consequently, chromatin is slightly condensed at enhancers and closed down around the TSS, the total RNA pol II (RNP2) quantity is reduced at the TSS and, the RNA transcription is decreased. Reduction of transcribed RNA molecules is associated with the venue of PRC2 to the chromatin and PRC2-mediated H3K27 methylation activity is potentially emphasized by SPI1. Thereby, the PRC2 complex reinforces HDAC1 transcriptional inhibition.

References

    1. Lara-Astiaso D., Weiner A., Lorenzo-Vivas E., Zaretsky I., Jaitin D.A., David E., Keren-Shaul H., Mildner A., Winter D., Jung S.et al.. Immunogenetics. Chromatin state dynamics during blood formation. Science. 2014; 345:943–949. - PMC - PubMed
    1. Huang J., Liu X., Li D., Shao Z., Cao H., Zhang Y., Trompouki E., Bowman T.V., Zon L.I., Yuan G.C.et al.. Dynamic control of enhancer repertoires drives lineage and stage-specific transcription during hematopoiesis. Dev. Cell. 2016; 36:9–23. - PMC - PubMed
    1. Kamath M.B., Houston I.B., Janovski A.J., Zhu X., Gowrisankar S., Jegga A.G., DeKoter R.P.. Dose-dependent repression of T-cell and natural killer cell genes by PU.1 enforces myeloid and B-cell identity. Leukemia. 2008; 22:1214–1225. - PubMed
    1. McKercher S.R., Torbett B.E., Anderson K.L., Henkel G.W., Vestal D.J., Baribault H., Klemsz M., Feeney A.J., Wu G.E., Paige C.J.et al.. Targeted disruption of the PU.1 gene results in multiple hematopoietic abnormalities. EMBO J. 1996; 15:5647–5658. - PMC - PubMed
    1. Scott E.W., Simon M.C., Anastasi J., Singh H.. Requirement of transcription factor PU.1 in the development of multiple hematopoietic lineages. Science. 1994; 265:1573–1577. - PubMed

Publication types

MeSH terms