. 2022 Aug 12;50(14):7972-7990.
doi: 10.1093/nar/gkac637.

SUPT3H-less SAGA coactivator can assemble and function without significantly perturbing RNA polymerase II transcription in mammalian cells

Affiliations

SUPT3H-less SAGA coactivator can assemble and function without significantly perturbing RNA polymerase II transcription in mammalian cells

Veronique Fischer et al. Nucleic Acids Res. .

Abstract

Coactivator complexes regulate chromatin accessibility and transcription. SAGA (Spt-Ada-Gcn5 Acetyltransferase) is an evolutionary conserved coactivator complex. The core module scaffolds the entire SAGA complex and adopts a histone octamer-like structure, which consists of six histone-fold domain (HFD)-containing proteins forming three histone-fold (HF) pairs, to which the double HFD-containing SUPT3H adds one HF pair. Spt3, the yeast ortholog of SUPT3H, interacts genetically and biochemically with the TATA binding protein (TBP) and contributes to global RNA polymerase II (Pol II) transcription. Here we demonstrate that (i) SAGA purified from human U2OS or mouse embryonic stem cells (mESC) can assemble without SUPT3H, (ii) SUPT3H is not essential for mESC survival, but required for their growth and self-renewal, and (iii) the loss of SUPT3H from mammalian cells affects the transcription of only a specific subset of genes. Accordingly, in the absence of SUPT3H no major change in TBP accumulation at gene promoters was observed. Thus, SUPT3H is not required for the assembly of SAGA, TBP recruitment, or overall Pol II transcription, but plays a role in mESC growth and self-renewal. Our data further suggest that yeast and mammalian SAGA complexes contribute to transcription regulation by distinct mechanisms.


Figures

Graphical Abstract
Graphical Abstract
In mammals, SAGA assembles without SUPT3H but unlike yeast, SUPT3H is not required for TBP deposition on promoters and global Pol II transcription, affecting only a subset of genes.
Figure 1.
Figure 1.
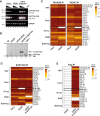
Absence of the SAGA subunit SUPT3H in human U2OS cells does not hinder assembly of the SAGA complex. (A) PCR of the coding sequence (CDS) of SUPT3H using cDNA obtained from HeLa cells, U2OS cells or U2OS cells re-expressing FLAG-SUPT3H (U2OS Fl-SUPT3H). Low and high exposures (exp.) are shown. GAPDH expression serves as loading control. n = 3 technical replicates. (B) Western blot analysis of U2OS parental cells, U2OS cells transfected with the empty expression vector pSG5, U2OS-cells over-expressing SUPT3H (U2OS-Fl-SUPT3H) and HeLa cells using anti-FLAG and anti-SUPT3H antibodies. The position of the proteins is indicated by arrows on the right of the blot. NS; non-specific signal. M: molecular weight marker (in kDa). (C) Log10-transformed bait-normalized NSAF (Normalized Spectral Abundance Factor) values of mass spectrometry results from anti-TADA2B and anti-TADA3 immunoprecipitations (IPs) of the SAGA complex from HeLa and U2OS nuclear extracts. n = 3 technical replicates in each IPs. (D) Log10-transformed bait-normalized NSAF values of mass spectrometry results from anti-SUPT20H IPs of the SAGA complex from HeLa, U2OS and U2OS Fl-SUPT3H nuclear extracts. n = 3 technical replicates. (E) Log10-transformed bait-normalized NSAF values of mass spectrometry results from anti-FLAG IPs, also shown in Supplementary Figure S2F. n = 3 technical replicates. In (C, D, E), the stars (*) indicates the bait proteins to which the IPs were normalized. The distinct SAGA modules are indicated as HAT = histone acetyltransferase; TF-int = transcription factor-interacting; DUB = deubiquitylation and Splicing. ND = not detected.
Figure 2.
Figure 2.
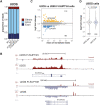
Only a small subset of Pol II-transcribed genes is responsive to the re-expression of SUPT3H in human U2OS cells. (A) Proportion of reads per genomic element for 4sU-seq experiments for two independent U2OS and Fl-SUPT3H clones. Exon = reads aligning to exons; Intron = reads aligning to introns, Others = reads aligning to intergenic regions, exon-intergenic junctions and exon-intron junctions. (B) UCSC genome browser views of 4sU-seq experiments on two differentially expressed genes (SCARA3 and EPHA4) between U2OS Fl-SUPT3H and U2OS cells. Forward and reverse strands are shown. Y axes indicate the nascent mRNA sequencing coverage. Arrows indicate direction of transcription. (C) U2OS versus U2OS Fl-SUPT3H 4sU-seq comparison represented as MA plot with the numbers (on the right) of significantly down- (blue) or up-regulated (orange) genes, using two independent clones. A threshold of 2 normalized reads per gene length was used to define actively expressed genes. The position of the two genes shown in (B) are indicated by black circles. (D) Violin plot representation of the distribution of the nascent transcripts log2 fold changes in TATA-less and TATA-box containing gene classes. The number of genes per category are indicated at the bottom. The statistical test performed is two-sided Wilcoxon rank-sum test; P value is indicated on the graph.
Figure 3.
Figure 3.
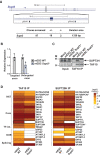
Loss of Supt3 does not impair mouse ESC survival or formation of the SAGA complex. (A) Top, schematic representation of the mouse Supt3 locus. The insert shows the position of the two gRNAs used to generate the Supt3–/– mESCs clones. Bottom, table showing the number of clones screened, the number of heterozygous (+/−) and of homozygous (−/−) clones obtained as well as the deletion size. (B) Validation of Supt3–/– cell lines by RT-qPCR revealing the absence of the targeted, out-of-frame exon 3 and overall reduced levels of the exon 3-deleted Supt3 mRNA. Error bars show mean ± standard deviation (SD) of two independent clones, with each assessment of the cell lines being based on the mean of three technical replicates. (C) Western blot analysis of input and elution fractions of anti-TAF10 immunoprecipitations (IP) from wildtype (WT) and Supt3–/– mESCs. M = molecular weight markers (in kDa). (D) Log10-transformed bait-normalized NSAF values of mass spectrometry results from anti-TAF10 IPs shown in (C) and anti-SUPT20H IPs. n = three technical replicates. Star (*) indicates the bait proteins, to which the IPs were normalized. The distinct SAGA modules are indicated as HAT = histone acetyltransferase; TF-int = transcription factor-interacting; DUB = deubiquitylation and Splicing. ND = not detected.
Figure 4.
Figure 4.
SUPT3H is required for mouse ESC growth and efficient self-renewal. (A) Clonal assay in FCS + LIF + 2i medium comparing WT and Supt3–/– mESCs. Colonies were stained for alkaline phosphatase activity. Top, representative images; bottom, quantification of colony numbers relative to WT condition. Error bars show mean ± standard deviation (SD) of four replicates from two biological replicates, with two independent clones each. (B) Quantification of colony areas using ImageJ. Error bars show mean ± standard deviation (SD) of four replicates from two biological replicates, with two independent clones each. (C) Growth curve analysis of viable cells comparing WT and Supt3–/– mESCs grown in FCS + LIF + 2i medium for 5 days. Error bars show mean ± standard deviation (SD) of two biological replicates using two independent clones. (D) Clonal assay in FCS + LIF medium comparing WT and Supt3–/– cells. Colonies were stained with crystal violet. Left, representative images; right, quantification of colony numbers relative to WT condition. Error bars show mean ± standard deviation (SD) of four replicates from two biological replicates, with two independent clones each. (E) Quantification of the number of colonies staining positive for alkaline phosphatase (AP+) in FCS + LIF medium normalized relative to WT cells. Error bars show mean ± standard deviation (SD) of four replicates from two biological replicates, with two independent clones each. (F) Relative mRNA levels of pluripotency transcription factors (as indicated) comparing WT and Supt3–/– mESCs grown in FCS + LIF medium. Expression was normalized to RNA polymerase III transcribed genes (Rn7sk and Rpph1) as well as to WT cells. Error bars show mean ± standard deviation (SD) of at least seven biological replicates (mean of three technical RT-qPCR replicates) using two independent clones each. The statistical tests performed are two-sided Wilcoxon rank-sum tests, P values are indicated on the graph. ns; not significant.
Figure 5.
Figure 5.
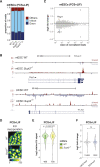
Loss of Supt3 in mouse ESC has no major effect on Pol II transcription regulation in FCS + LIF + 2i medium. (A) Proportion of reads per genomic element for 4sU-seq experiments in two independent wildtype (WT) and Supt3–/– mESC clones in FCS + LIF + 2i medium. Exon = reads aligning to exons; Intron = reads aligning to introns, Others = reads aligning to intergenic regions, exon-intergenic junctions and exon-intron junctions. (B) UCSC genome browser views of 4sU-seq experiments on two differentially expressed genes (Atxn1 and Reep1) between WT and Supt3–/– mESCs. Forward and reverse strands are shown. Y axes indicate the nascent mRNA sequencing coverage. Arrows indicate direction of transcription. (C) Supt3–/– versus WT mESCs 4sU-seq comparison represented as MA plot with the numbers (on the right) of significantly down- (blue) or up-regulated (orange) genes, in two WT and Supt3–/– mESC clones. A threshold of 2 normalized reads per kb gene length was used to define actively expressed genes. The position of the two differentially expressed genes shown in (B) are indicated by black circles. (D) Representative images of 5-ethynyl uridine (EU) incorporation in WT and Supt3–/– mESCs in FCS + LIF + 2i medium. Colour scale (Green Fire Blue LUT scale) is indicated at the bottom. Scale bar; 10 μm. (E) Quantification of the EU incorporation in WT and Supt3–/– mESCs in FCS + LIF + 2i medium, normalized to the WT condition and expressed in log2. The number of cells quantified is indicated at the bottom. (F) Violin plot representation of the distribution of the nascent transcripts log2 fold changes in TATA-less and TATA-box containing gene classes. The number of genes per category is indicated at the bottom. The statistical test performed is two-sided Wilcoxon rank-sum test. P values are indicated on the graphs. ns; not significant.
Figure 6.
Figure 6.
Loss of Supt3 in mouse ESC has no major effect on Pol II transcription regulation in FCS + LIF medium. (A) Proportion of reads per genomic element for 4sU-seq experiments in two independent wildtype (WT) and Supt3–/– mESC clones. Exon = reads aligning to exons; Intron = reads aligning to introns, Others = reads aligning to intergenic regions, exon-intergenic junctions and exon-intron junctions. (B) UCSC genome browser views of 4sU-seq experiments on two differentially expressed genes (Plagl1 and Zfy1) between WT and Supt3–/– mESCs. Forward and reverse strands are shown. Y axes indicate the nascent mRNA sequencing coverage. Arrows indicate direction of transcription. (C) Supt3–/– versus WT mESCs 4sU-seq comparison represented as MA plot with the numbers (on the right) of significantly down- (blue) or up-regulated (orange) genes, in two WT and Supt3–/– mESC clones. A threshold of 2 normalized reads per kb gene length was used to define actively expressed genes. The position of the two differentially expressed genes shown in (B) are indicated by black circles. (D) Representative images of 5-ethynyl uridine (EU) incorporation in WT and Supt3–/– mESCs in FCS + LIF medium. Colour scale (Green Fire Blue LUT scale) is indicated at the bottom. Scale bar; 10 μm. (E) Quantification of the EU incorporation in WT and Supt3–/– mESCs in FCS + LIF medium, normalized to the WT condition and expressed in log2. The number of cells quantified is indicated at the bottom. (F) Violin plot representation of the distribution of the nascent transcripts log2 fold changes in TATA-less and TATA-box containing gene classes. The number of genes per category is indicated at the bottom. The statistical test performed is two-sided Wilcoxon rank-sum test. P values are indicated on the graphs. ns; not significant.
Figure 7.
Figure 7.
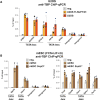
Loss of SUPT3H in human U2OS cells or mouse ESCs does not significantly affect TBP binding at promoters. (A, B) Quantification of anti-TBP ChIP-qPCR experiments in U2OS and U2OS Fl-SUPT3H cells (A) or in WT and Supt3–/– mESCs (B) at promoters of selected genes (as indicated) and at two independent intergenic regions. TATA-less and TATA-box-containing promoters are indicated. ChIP-qPCR experiments without antibody were used as negative control (neg.). Error bars show mean ± standard deviation (SD) of at four and three biological replicates using two independent clones for human and mouse data, respectively, in each sample, the mean shows at least four technical RT-qPCR replicates. Statistical test performed is two-sided Wilcoxon rank-sum test. Statistical significance (P < 0.05) was not reached.

Similar articles

Cited by

References

    1. Roeder R.G. 50+ years of eukaryotic transcription: an expanding universe of factors and mechanisms. Nat. Struct. Mol. Biol. 2019; 26:783–791. - PMC - PubMed
    1. Chen X., Qi Y., Wu Z., Wang X., Li J., Zhao D., Hou H., Li Y., Yu Z., Liu W.et al. .. Structural insights into preinitiation complex assembly on core promoters. Science. 2021; 372:eaba8490. - PubMed
    1. Spedale G., Timmers H.T., Pijnappel W.W.. ATAC-king the complexity of SAGA during evolution. Gene Dev. 2012; 26:527–541. - PMC - PubMed
    1. Helmlinger D., Tora L.. Sharing the SAGA. Trends Biochem. Sci. 2017; 42:850–861. - PMC - PubMed
    1. Helmlinger D., Papai G., Devys D., Tora L.. What do the structures of GCN5-containing complexes teach us about their function?. Biochim. Biophys. Acta Gene Regul. Mech. 2021; 1864:194614. - PubMed

Publication types