. 2023 Feb 13;146(2):475-491.
doi: 10.1093/brain/awac273.

TRPA1 modulation by Sigma-1 receptor prevents oxaliplatin-induced painful peripheral neuropathy

Affiliations

TRPA1 modulation by Sigma-1 receptor prevents oxaliplatin-induced painful peripheral neuropathy

Aida Marcotti et al. Brain. .

Abstract

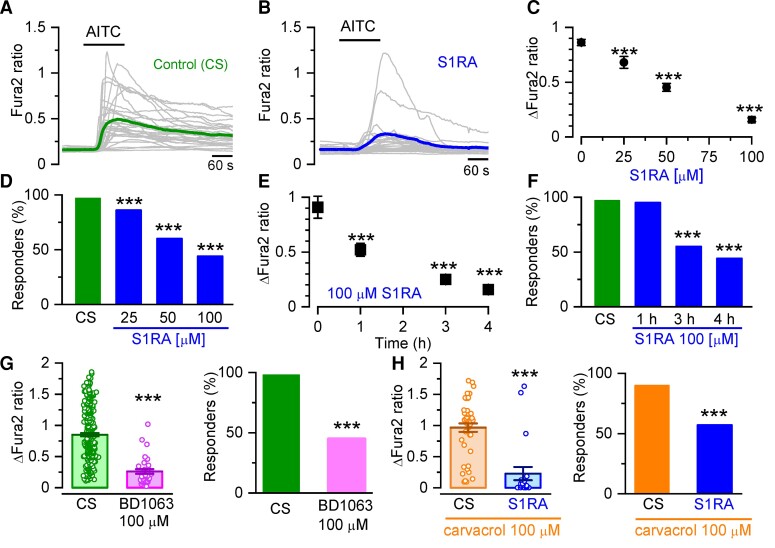
Chemotherapy-induced peripheral neuropathy is a frequent, disabling side effect of anticancer drugs. Oxaliplatin, a platinum compound used in the treatment of advanced colorectal cancer, often leads to a form of chemotherapy-induced peripheral neuropathy characterized by mechanical and cold hypersensitivity. Current therapies for chemotherapy-induced peripheral neuropathy are ineffective, often leading to the cessation of treatment. Transient receptor potential ankyrin 1 (TRPA1) is a polymodal, non-selective cation-permeable channel expressed in nociceptors, activated by physical stimuli and cellular stress products. TRPA1 has been linked to the establishment of chemotherapy-induced peripheral neuropathy and other painful neuropathic conditions. Sigma-1 receptor is an endoplasmic reticulum chaperone known to modulate the function of many ion channels and receptors. Sigma-1 receptor antagonist, a highly selective antagonist of Sigma-1 receptor, has shown effectiveness in a phase II clinical trial for oxaliplatin chemotherapy-induced peripheral neuropathy. However, the mechanisms involved in the beneficial effects of Sigma-1 receptor antagonist are little understood. We combined biochemical and biophysical (i.e. intermolecular Förster resonance energy transfer) techniques to demonstrate the interaction between Sigma-1 receptor and human TRPA1. Pharmacological antagonism of Sigma-1R impaired the formation of this molecular complex and the trafficking of functional TRPA1 to the plasma membrane. Using patch-clamp electrophysiological recordings we found that antagonists of Sigma-1 receptor, including Sigma-1 receptor antagonist, exert a marked inhibition on plasma membrane expression and function of human TRPA1 channels. In TRPA1-expressing mouse sensory neurons, Sigma-1 receptor antagonists reduced inward currents and the firing of actions potentials in response to TRPA1 agonists. Finally, in a mouse experimental model of oxaliplatin neuropathy, systemic treatment with a Sigma-1 receptor antagonists prevented the development of painful symptoms by a mechanism involving TRPA1. In summary, the modulation of TRPA1 channels by Sigma-1 receptor antagonists suggests a new strategy for the prevention and treatment of chemotherapy-induced peripheral neuropathy and could inform the development of novel therapeutics for neuropathic pain.

Keywords: Sigma-1 receptor; TRPA1; chemotherapy; cold allodynia; neuropathic pain.


Figures

Figure 1
Figure 1
Sigma-1R antagonists inhibit intracellular calcium responses in TRPA1 expressing cells. (A) Representative intracellular calcium responses monitored with Fura-2 in response to AITC (50 µM) after incubation in CS, 4 h). Green trace is the average of 32 cells (grey traces) expressing hTRPA1-tGFP. (B) Same as in A but after incubation with S1RA (100 µM, 4 h). The blue trace is the average of 30 cells (grey traces) expressing hTRPA1-tGFP. (C) Dose-response curve of S1RA effects. ***P < 0.001 (one-way ANOVA in combination with Dunnett’s post hoc test) CS n = 37, S1RA 25 µM n = 68, 50 µM n = 90, 100 µM n = 64. (D) Percentage of responding cells to AITC after pre-incubation (4 h) with S1RA at different concentrations. ***P < 0.001 (Fisher’s exact test) versus CS. (E) Time-dependent inhibition of TRPA1 responses to AITC (50 µM) by pre-incubation with S1RA (100 µM, 4 h). ***P < 0.001 (ANOVA in combination with Dunnett’s post hoc test). CS n = 37, 1 h n = 21, 3 h n = 77, 4 h n = 64. (F) Effect of incubation time with S1RA (100 µM, 4 h) on AITC responses. ***P < 0.001 (Fisher’s exact test). (G) Graph summarizing the effect of pre-incubation with BD1063 (100 µM, 4 h, n = 255) versus CS n = 255 ***P < 0.001 (unpaired t-test). (H) Graph summarizing the effect of pre-incubation with S1RA (100 µM, 4 h) to responses when the cells were stimulated with carvacrol (100 µM, n = 21) versus CS n = 45. ***P < 0.001 (unpaired t-test).
Figure 2
Figure 2
TRPA1 inhibition by Sigma-1R antagonists depends on Sigma-1R expression. (A) Top: Representative intracellular calcium responses to AITC (50 µM) in Sigma-1R silenced HEK293 cells (S1R-KO) transfected with hTRPA1-tGFP. Cells were incubated with CS (4 h) or in S1RA (100 µM, 4 h). Green and blue traces represent the averages of individual cells in grey. Bottom: The same experiment as in A but in hTRPA1-tGFP cells cotransfected with hSigma-1R-mCherry. (B) Summary histograms of mean ± SE calcium responses to AITC in S1R-KO cells + hTRPA1-tGFP in control (green, n = 312), S1R-KO cells + hTRPA1-tGFP in S1RA (100 µM, 4 h) (blue, n = 276), S1R-KO cells + hTRPA1-tGFP+ hSigma-1R-mCherry in control (magenta, n = 118) and S1R-KO cells + hTRPA1-tGFP+ hSigma-1R-mCherry in S1RA (100 µM, 4 h) (pink, n = 144). ***P < 0.001 (ANOVA in combination with Bonferroni’s post hoc test). (C) Western blot of HEK293 cells transiently transfected with hTRPA1-tGFP, WT HEK293 cells and S1R-KO HEK293 cells, demonstrating the expression of endogenous Sigma-1R in WT cells and the absence in S1R-KO cells.
Figure 3
Figure 3
Sigma-1R expression is necessary for the reduction of TRPA1 whole-cell currents by S1RA. (A) Representative time course of whole-cell currents, from the HEK293 hTRPA1-tGFP stable cell line, in response to the indicated repeated voltage ramp protocol (red) and AITC (50 µM), HP = −60 mV, in CS and after S1RA pre-incubation (100 µM, 4 h). Note the slow development of current and the reduced peak amplitude after S1RA incubation. (B) Average IV relationships from HEK293-hTRPA1-tGFP cells using the protocol shown in A recorded in control (n = 10) and S1RA at different concentrations: 10 µM (n = 10), 30 µM (n = 10) and 100 µM (n = 10). Average of maximal response to AITC in each trace. (C) Dose-response curve of S1RA effects on HEK293 hTRPA1-tGFP cells in response to AITC (50 µM). Normalized current density at −60 mV with respect to CS. ***P < 0.001 (ANOVA in combination with Dunnett’s post hoc test). (D) Average IV relationships from WT HEK293 cells transiently transfected with hTRPA1-tGFP in control (n = 15), S1RA pre-incubation (100 µM, 4 h, n = 12) and in Sigma-1R silenced cells transiently transfected with hTRPA1-tGFP (S1R-KO) recorded after pre-incubation in CS for 4 h (n = 12) or S1RA (100 µM, 4 h, n = 18). Average of maximal response to AITC in each case. (E) Summary of individual and mean ± SE current density at −60 and +60 mV for the different experimental conditions shown in D. **P < 0.01 (ANOVA in combination with Bonferroni’s post hoc test). Results from transient transfections were obtained in seven independent experiments.
Figure 4
Figure 4
S1RA impairs the formation of TRPA1–Sigma-1R complexes and reduces TRPA1 expression at the plasma membrane. (A) Co-immunoprecipitation of TRPA1 and Sigma-1R-EYFP in cotransfected HEK293 cells. Input is one-tenth of the total protein used in each immunoprecipitation. TRPA1 was pulled down by Sigma-1R-EYFP (lane 1) using GFP-Trap (Chromotek), while it was not when Sigma-1R-EYFP was not present (lane 2). The figure is representative of four independent protein extractions. GFP-Trap agarose beads do not recognize tGFP. (B) Detection of net sensitized emission (FRET) levels between hTRPA1-GFP and hSigma-1R-mCherry in transfected HEK293 cells. Top: Representative image of the fluorescence signal of hTRPA1-tGFP+Sigma-1R-mCherry as well as the signal in the FRET channel (scale bar = 20 µM). Bottom: Summary histogram of FRET levels (as a percentage of RhoCG FRET) of TRPA1-tGFP+mCherry (negative control, green bar) and TRPA1-tGFP+Sigma1-mCherry in control conditions (black bar) and after S1RA incubation (100 µM, 4 h) (blue bar). ###P < 0.001 (ANOVA in combination with Bonferroni’s post hoc test) test TRPA1-tGFP+soluble mCherry versus all groups, **P < 0.01 (unpaired t-test), S1RA untreated versus treated hTRPA1-tGFP+Sigma-1R-mCherry transfected cells. (C) Left: The time course of hTRPA1-tGFP TIRF fluorescence recovery after TIRF photobleaching, in control treated cells (red trace) and cells incubated with S1RA (100 µM, 4 h, blue trace). *P < 0.05 (unpaired t-test). Error bars represent SE. Representative TIRF images of HEK293 transfected with hTRPA1-GFP before (top), immediately after photobleaching (middle) and after 10 min recovery (bottom), scale bar = 10 µM. (D) Dose-response curves of AITC-evoked calcium responses in stable HEK293-hTRPA1-tGFP cells in CS (red) and pre-incubated with S1RA (100 µM, 4 h, blue). Values have been normalized to 500 µM AITC in CS. The lines represent fits to Hill functions (Y = Ymax/(1 + (EC50/X)nH)) with parameters EC50 = 14.12 ± 0.11 µM and 3.60 ± 0.03 µM, Ymax = 1.009 ± 0.002 and 0.797 ± 0.002 and nH = 1.03 ± 0.01 an 1.29 ± 0.01 in control and S1RA (100 µM, 4 h), respectively. (E) Western blot of total protein (TP) extracts from HEK293-hTRPA1-tGFP stable line incubated in CS for 24 h) or S1RA (25 µM, 24 h). A non-specific band at ∼70 kDa is exposed with anti-GAPDH (1:5000 G9545, Sigma-Aldrich). Immunodetection values in S1RA and CS, normalized with respect to GAPDH, are similar (n = 5 independent extractions, P > 0.05, unpaired t-test). (F) Representative western blot from biotinylation assays of hTRPA1- tGFP cells. Total expression of TRPA1 was assessed by directly immunoblotting 15 µg of each cell lysate. TRPA1 cell surface (Plasma Membrane protein, PM) expression was calculated by expressing the intensities of the TRPA1 bands in the avidin-bound fraction as a fraction of those in the corresponding cell lysates (n = 3, *P < 0.05, unpaired t-test). GAPDH was used as a negative control blot for the presence of a soluble protein in the avidin bound fraction (ABF).
Figure 5
Figure 5
S1RA reduces TRPA1 activity in mouse DRG nociceptors. (A) TRPA1(+) neurons in cultured DRGs from Trpa1 Cre-tdTomato mice were identified by their red fluorescence. AITC (100 µM) evoked action currents in 100% of neurons in CS (n = 8) and in 55% after S1RA incubation (6/11) (*P < 0.05, Fisher’s exact test). Firing frequency during the 2 min of AITC application. ***P < 0.001 (unpaired t-test). (B) Representative cell-attached recordings of TRPA1-expressing DRG neurons (n = 5 mice). Responses to AITC (100 µM) and high KCl (30 mM) after incubation with CS, 4 h) or S1RA (100 µM, 4 h). Note the robust firing in CS. After S1RA incubation (100 µM, 4 h), six neurons showed a weak response (S1R1-R, responder) while five did not fire action potentials (S1RA-NR, non-responder). Note that in neurons in which no response to AITC was observed, an impulse discharge could be evoked with 30 mM KCl. (C) Representative whole-cell current-clamp recordings of TRPA1(+) DRG neurons (n = 8 mice) showing the response to AITC (100 µM) and KCl (30mM) after incubation with CS-4 h or S1RA (100 µM, 4 h). After S1RA, some neurons fired AP (S1RA-R) while others showed a subthreshold depolarization but no AP firing (S1RA-NR). Both fired AP in response to high KCl. (D) Histograms summarizing the amplitude of AITC-evoked depolarization, number of action potentials and mean firing frequency of neurons: in CS (n = 11 out of 11) and after S1RA incubation (n = 5 of 9) responded to AITC. Mean ± SE **P < 0.001, *P < 0.05 (unpaired t-test). (E) Left: Representative whole-cell voltage-clamp recordings (n = 2 mice) of TRPA1(+) neurons (Vhold = −73 mV). AITC-evoked inward current in CS for 4 h incubated neurons (−9.6 ± 1.4 pA/pF n = 6) that was reduced in S1RA (100 µM, 4 h) incubated neurons (−4.8 ± 1.3 pA/pF n = 5), *P < 0.05 (unpaired t-test). Electrophysiological recordings were performed on 15 independent DRG cultures.
Figure 6
Figure 6
Systemic S1RA administration reduces TRPA1-dependent cold and mechanical hypersensitivity in oxaliplatin-treated mice. (A) Time line of experimental protocol. Oxaliplatin was injected three times on alternate days. Oxaliplatin effects to mild cold (acetone) or mechanical stimulation (von Frey) were evaluated 3 days before and 7 days after first injection. Noxious cold was evaluated 8–12 days after the first oxaliplatin injection. (B) Responses to acetone in WT mice before (baseline, BS) and after vehicle (green, n = 5), and before and after oxaliplatin (orange, n = 5) ***P< 0.001, n.s. P > 0.05 (unpaired t-test). Paired t-test when responses of the same mice were compared (lines connecting symbols). (C) Cold (acetone) sensitivity in TRPA1 KO mice before (BS) and after vehicle (purple-green, n = 5), and before (BS) and after oxaliplatin (purple-orange, n = 7) injection. n.s. P > 0.05 (unpaired t-test). Paired t-test when the same mice were compared. Oxaliplatin did not induce cold allodynia in TRPA1 KO mice. (D) Evaluation of noxious cold sensitivity by unilateral cold plate test after vehicle (WT green, n = 7, TRPA1 KO purple-green, n = 5) or oxaliplatin injection (WT orange n = 11, TRPA1 KO purple-orange n = 7) ***P < 0.001, n.s. P > 0.05 (one-way ANOVA in combination with Bonferroni’s post hoc test). Oxaliplatin-induced cold hyperalgesia in WT but not in TRPA1 KO mice. (E) Mechanical withdrawal thresholds, in WT mice before and after vehicle injection (green, n = 9), before and after oxaliplatin injection (orange, n = 11). ***P < 0.001, n.s. P > 0.05 (unpaired t-test). Paired t-test when the same mice were compared. Oxaliplatin induced a clear mechanical allodynia. (F) Mechanical withdrawal thresholds in TRPA1 KO mice before and after vehicle injection (purple-green, n = 5), and before and after oxaliplatin injection (purple-orange, n = 7), *P < 0.05, n.s. P > 0.05 (unpaired t-test). Paired t-test when the same mice were compared. Oxaliplatin induces less mechanical allodynia in TRPA1 KO than in WT mice. (G) Timeline of experimental protocol to evaluate preventive effects of S1RA. Mice were evaluated 3 days before and 7–12 after first oxaliplatin (OXA) injection. (H) Mild cold (acetone) sensitivity before and after or oxaliplatin (OXA) injections. One group received saline combined with OXA (orange-pink, n = 12), and the other S1RA combined with OXA (orange-blue, n = 12) **P < 0.01, *P < 0.05 (paired t-test). (I) Unilateral cold plate test in saline + OXA injected mice (orange-pink, n = 12), and S1RA + OXA injected mice (orange-blue, n = 12). *P < 0.05 (unpaired t-test). (J) Mechanical sensitivity before (black) and after saline + OXA injections (orange-pink, n = 12) or S1RA + OXA (orange-blue, n = 12) ***P < 0.001, *P < 0.05 (paired t-test).
Figure 7
Figure 7
In vivo and in vitro S1RA treatment normalizes TRPA1 responses in DRG neurons from oxaliplatin-treated mice. (A) Oxaliplatin (OXA) was injected three times on alternate days. DRG neurons were cultured and studied by Ca2+ imaging at Days 8–12, shortly after mice were evaluated by unilateral cold plate test. Calcium responses in DRG neurons from mice that received vehicle (left) and OXA injections (middle). Right: Responses from mice that received OXA injections and were incubated in S1RA (100 µM, 4 h). Individual traces of calcium elevations evoked by AITC (50 µM) for each condition are shown in grey. Coloured traces represent averages of the respective individual traces. (B) Histograms summarizing the sensitization of the AITC response by OXA and the inhibition by S1RA. Vehicle/CS n = 149, OXA/CS n = 118, OXA/S1RA n = 172, ***P < 0.001, n.s. P > 0.05 (one-way ANOVA in combination with Bonferroni’s post hoc test). (C) Mice received saline via S1RA injections starting 3 days before the first OXA injection until Day 7. DRG neurons were cultured and studied by Ca2+ imaging at Days 8–10, right after mice were evaluated by unilateral cold plate test. Representative traces of calcium elevations evoked by AITC (50 µM). DRG neurons from mice injected with Saline+OXA (left, average in pink) and S1RA + OXA (right, average in blue). (D) Histograms summarizing the preventive effect of S1RA in the sensitization of AITC responses by OXA. Saline/OXA (n = 797), S1RA/OXA (n = 1208), ***P < 0.001 (unpaired t-test).

References

    1. Staff NP, Grisold A, Grisold W, Windebank AJ. Chemotherapy-induced peripheral neuropathy: A current review. Ann Neurol. 2017;81:772–781. - PMC - PubMed
    1. Gordon-Williams R, Farquhar-Smith P. Recent advances in understanding chemotherapy-induced peripheral neuropathy. F1000Res. 2020;9:177. - PMC - PubMed
    1. Seretny M, Currie GL, Sena ES, et al. . Incidence, prevalence, and predictors of chemotherapy-induced peripheral neuropathy: A systematic review and meta-analysis. Pain. 2014;155:2461–2470. - PubMed
    1. Ventzel L, Jensen AB, Jensen AR, Jensen TS, Finnerup NB. Chemotherapy-induced pain and neuropathy: A prospective study in patients treated with adjuvant oxaliplatin or docetaxel. Pain. 2016;157:560–568. - PubMed
    1. Flatters SJL, Dougherty PM, Colvin LA. Clinical and preclinical perspectives on chemotherapy-induced peripheral neuropathy (CIPN): A narrative review. Br J Anaesth. 2017;119:737–749. - PubMed

Publication types

Supplementary concepts