. 2022 Sep;298(9):102297.
doi: 10.1016/j.jbc.2022.102297. Epub 2022 Jul 21.

EPDR1 is a noncanonical effector of insulin-mediated angiogenesis regulated by an endothelial-specific TGF-β receptor complex

Affiliations

EPDR1 is a noncanonical effector of insulin-mediated angiogenesis regulated by an endothelial-specific TGF-β receptor complex

Tasmia Ahmed et al. J Biol Chem. 2022 Sep.

Abstract

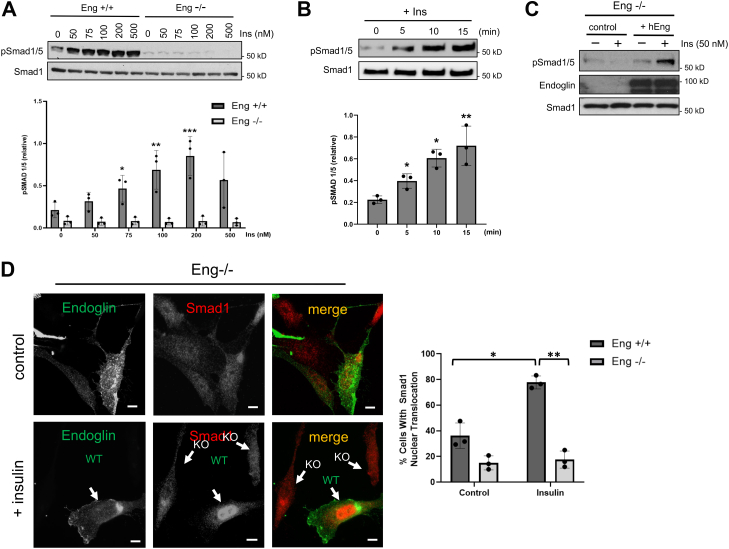
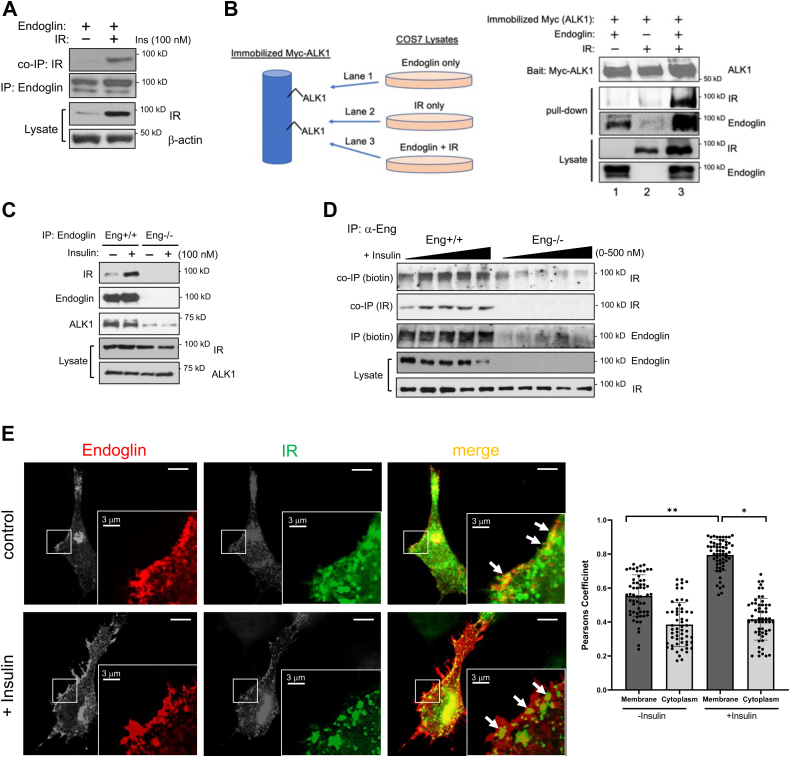
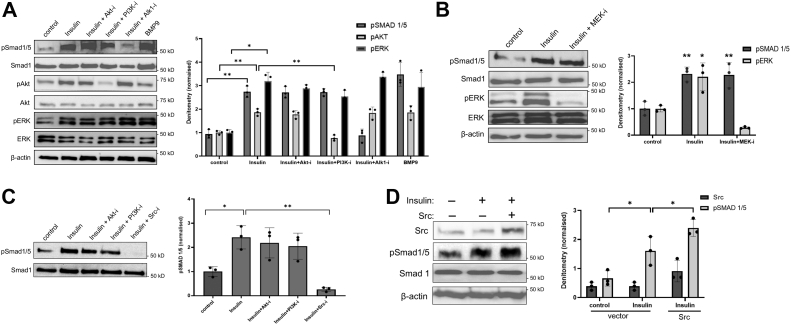
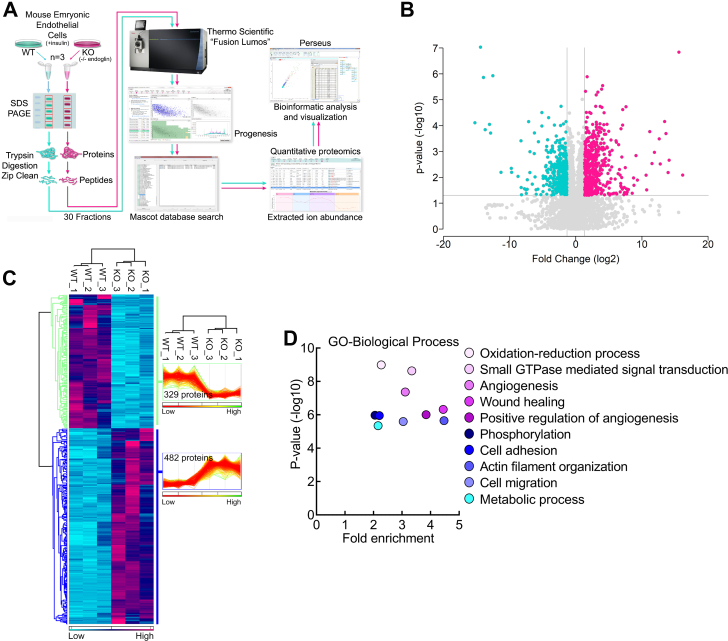
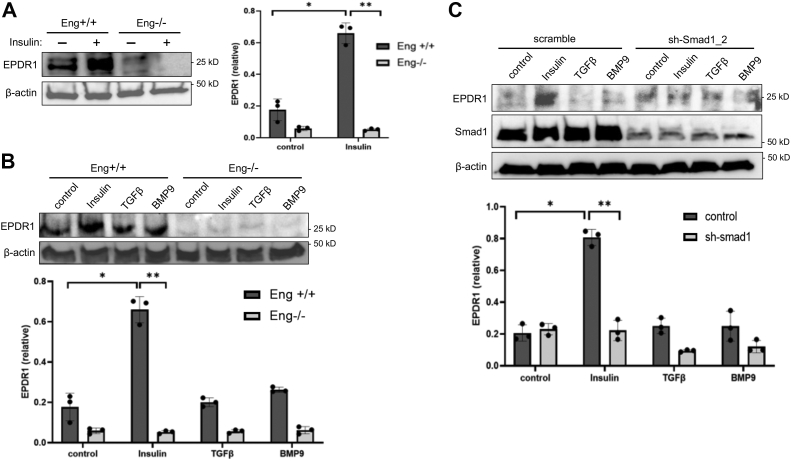
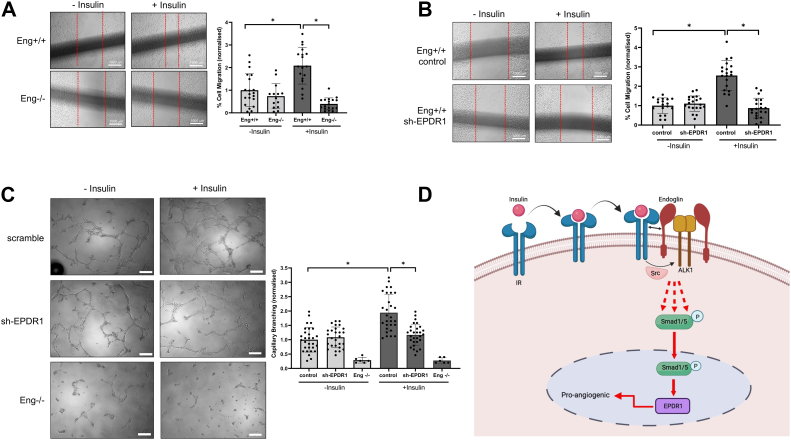
Insulin signaling in blood vessels primarily functions to stimulate angiogenesis and maintain vascular homeostasis through the canonical PI3K and MAPK signaling pathways. However, angiogenesis is a complex process coordinated by multiple other signaling events. Here, we report a distinct crosstalk between the insulin receptor and endoglin/activin receptor-like kinase 1 (ALK1), an endothelial cell-specific TGF-β receptor complex essential for angiogenesis. While the endoglin-ALK1 complex normally binds to TGF-β or bone morphogenetic protein 9 (BMP9) to promote gene regulation via transcription factors Smad1/5, we show that insulin drives insulin receptor oligomerization with endoglin-ALK1 at the cell surface to trigger rapid Smad1/5 activation. Through quantitative proteomic analysis, we identify ependymin-related protein 1 (EPDR1) as a major Smad1/5 gene target induced by insulin but not by TGF-β or BMP9. We found endothelial EPDR1 expression is minimal at the basal state but is markedly enhanced upon prolonged insulin treatment to promote cell migration and formation of capillary tubules. Conversely, we demonstrate EPDR1 depletion strongly abrogates these angiogenic effects, indicating that EPDR1 is a crucial mediator of insulin-induced angiogenesis. Taken together, these results suggest important therapeutic implications for EPDR1 and the TGF-β pathways in pathologic angiogenesis during hyperinsulinemia and insulin resistance.

Keywords: Smad; TGF beta; angiogenesis; endothelial biology; insulin.


Conflict of interest statement

Conflict of interest The authors declare that they have no conflicts of interest with the contents of this article.

Figures

Figure 1
Figure 1
Insulin-induced Smad1/5 activation requires endoglin expression in ECs.A, Western blot shows pSmad1/5 levels in response to insulin at indicated concentrations in Eng+/+ and Eng−/− MEECs for 30 min. Cells were serum starved for 4 to 6 h prior to stimulation. Data are representative of three independent experiments. Blots were analyzed by densitometry and pSmad1/5 ratio to total Smad1 was quantified at different insulin concentrations. Error bars indicate mean with SD and type 2 t test result shows ∗p < 0.05, ∗∗p < 0.03, ∗∗∗p < 0.02 relative to Eng +/+ control (no treatment). B, Western blot shows pSmad1/5 levels at indicated time points upon insulin (100 nM) treatment in Eng+/+ MEECs with prior 6 h serum starvation. Data are representative of three independent experiments. Densitometry ratio of pSmad1/5 to total Smad1 was quantified at different insulin concentrations. Error bars indicate mean with SD and type 2 t test result shows ∗p < 0.05, ∗∗p < 0.03 relative to control (no treatment). C, Western blot shows pSmad1/5 levels upon insulin stimulation for 30 min in Eng−/− cells with or without ectopic overexpression of human endoglin (hEng) or vector control. D, representative immunofluorescence images show Eng−/− cells transiently transfected with endoglin expression vector. Serum starved cells (4–6 h) were treated with PBS control or insulin (30 min) before fixing, then stained for endoglin (green) and endogenous Smad1 (red). White arrows indicate endoglin-positive (WT) or endoglin KO cells and their Smad1 distribution. Graph represents percentage of endoglin-positive cells showing strong Smad1 nuclear translocation. About 25 cells were analyzed per group from three independent experiments. The scale bar represents 10 μm. Error bars indicate mean with SD and type 2 t test result shows ∗p < 0.05, ∗∗p < 0.005 relative to Eng+/+ control (no treatment). EC, endothelial cell; MEEC, mouse embryonic EC.
Figure 2
Figure 2
Endoglin associates with insulin receptor (IR) at the cell surface.A, COS-7 cells overexpressing endoglin and IR were immunoprecipitated with endoglin antibody. Western blot shows IR co-IP (top panel) upon endoglin IP (second panel) ALK1 in the presence or absence of insulin stimulation for 15 min after 6 h of serum starvation. B, COS-7 cells transiently overexpressing Myc-tagged ALK1 alone was immobilized on anti-Myc bead column (schematic). An ALK1 pull down was performed using separate cell lysates prepared from COS-7 cells overexpressing endoglin alone, IR alone, or endoglin and IR. Western blots show the immunocomplex comprising ALK1 (top panel), IR (second panel), and endoglin (third panel). C, Western blot shows the co-IP of endogenous endoglin, IR, and Alk1 in the presence or absence of insulin stimulation for 15 min. Eng+/+ and Eng −/− ECs serum starved for 6 h were treated with insulin. Cell lysates were immunoprecipitated for endoglin (second panel) and observed for the co-IP of IR (top panel) and Alk1 (third panel). D, Eng+/+ and Eng−/− ECs serum starved for 6 h were treated with insulin (0, 50, 100, 200, and 500 nM) for 10 min prior to cell surface biotinylation. Cell lysates were immunoprecipitated for endoglin, then resolved on SDS-PAGE and blotted for biotinylated IR and endoglin (top and third panels, respectively) and total co-IP of IR (second panel). Bottom two panels show endogenous endoglin and IR in the cell lysates. E, representative immunofluorescence images of Eng−/− MEECs transiently expressing endoglin and GFP-tagged IR. Transfected cells were treated with or without insulin (30 min) before fixing and staining for endoglin (red). Arrows indicate the colocalization of endoglin and IR along the membrane (yellow). About 25 cells per group (three ROIs per cell) were quantified using Image J plugin JACoP to determine Pearsons correlation coefficient near the cell membrane and cytoplasm. The scale bar represents 10 μm. Error bars indicate mean with SD and type 2 t test result shows ∗p < 0.001; ∗∗p < 0.0001 relative to control (no treatment) or as indicated. The scale bar represents 10 μm. EC, endothelial cell; IP, immunoprecipitation; ROI, region of interest.
Figure 3
Figure 3
Src promotes insulin-induced smad1/5 activation.A, Western blots show phosphorylated levels of Smad1/5, Akt, and ERK in Eng+/+ ECs treated with insulin (100 nM) alone or in the presence of 15 min pretreatment with small molecule inhibitors of Akt (Akt-i; 10 μM), PI3K (PI3K-i; 20 μM), or ALK1 (Alk1-i; 0.6 μM). BMP9 treatment was used as positive control (1 nM). Data are representative of three independent experiments. Graph shows densitometry analysis of the ratio of pSmad1/5 to total Smad1, pAkt to total, and pERK to total. Fold change of pSmad1/5, pAKT, and pERK levels relative to control (no treatment) cells are represented. Error bars indicate mean with SD and type 2 t test result shows ∗p < 0.008; ∗∗p < 0.001, compared to control or as indicated. B, Western blots show pSmad1/5 and pERK levels in Eng+/+ cells treated with insulin (100 nM) alone or in the presence of pretreatment with MEK inhibitor (MEK-i; 30 μM) for 15 min. Cell lysates were immunoblotted for pSmad1/5 and pERK. Blots of three independent experiments were analyzed by densitometry and the ratio of pSmad1/5 to total Smad1 and pERK to total ERK were quantified. Fold changes of pSmad1/5 and pERK expression relative to control (no treatment) cells are represented in the bar graphs. Error bars indicate mean with SD and type 2 t test result shows ∗p < 0.008; ∗∗p< 0.001 compared to control. C, Western blot shows pSmad1/5 in response to insulin (100 nM) alone or in combination with pretreatment with Akt-i, PI3K-i, or Src-i (15) min. Blots of three independent experiments were analyzed by densitometry and ratio of pSmad1/5 to total Smad1 was quantified. Fold change of pSmad1/5 expression relative to control (no treatment) cells is represented in the bar graphs. Error bars indicate mean with SD and type 2 t test result shows ∗p < 0.008; ∗∗p< 0.001 compared to control or as indicated. D, Eng+/+ ECs transfected with either vector control or Src (1 μg) was treated with insulin (100 nM) for 30 min. Cell lysates were immunoblotted for Src and pSmad1/5. Blots of three independent experiments were analyzed by densitometry and ratios of Src to β-actin and pSmad1/5 to total smad1 were quantified. Normalized values of Src and pSmad1/5 are shown. Error bars indicate mean with SD and type 2 t test result shows ∗p < 0.05 compared to control or as indicated. EC, endothelial cell.
Figure 4
Figure 4
Quantitative proteomics analysis.A, schematic shows the MS-proteomics workflow. Lysates collected from Eng+/+ and Eng−/− EC treated with insulin (100 nM for 16 h) (n = 3) were resolved by SDS-PAGE for gel-based fractionation followed by in-gel tryptic digestion, then subjected to tandem MS prior to data quantification using Progenesis QI for Proteomics and Mascot-based database searching. B, volcano plot of the proteins identified in the Eng+/+ and Eng−/− EC lysates. Above the horizontal gray line represents the cut-off for a p value of <0.05 while the two vertical lines represent the cut-off values of 2-fold change in either the positive or negative direction. C, unbiased hierarchical clustering of the 811 significantly affected proteins confirmed that the expression patterns across the different individual biological samples cluster together accordingly as either Eng+/+ and Eng−/−. A heat map and linked dendrogram of the hierarchical clustering results provide a visual representation of the clustered matrix and the associated profile plots further reveal consistency within groups of the corresponding protein expression patterns. D, scatter plots of the biological processes gene ontology enrichment findings for Eng+/+ and Eng−/− ECs upon insulin treatment. EC, endothelial cell; MS, mass spectrometry.
Figure 5
Figure 5
EPDR1 is a Smad1 gene target induced by insulin but not TGF-β or BMP9.A, Western blot shows EPDR1 expression upon insulin treatment (100 nM) for 16 h in Eng+/+ and Eng−/− ECs. Blots of three independent experiments were analyzed by densitometry. Ratio of EPDR1 to β-actin was quantified and normalized EPDR1 level is demonstrated in the bar graph. Error bars indicate mean with SD and type 2 t test result shows ∗p < 0.001; ∗∗p< 0.0001 compared to Eng+/+ control or as indicated. B, Western blot shows EPDR1 expression upon treatment with insulin (100 nM), TGFβ (200 pM), or BMP9 (1 nM) treatment for 16 h in Eng+/+ and Eng−/− MEECs. Blots of three independent experiments were analyzed by densitometry. Ratio of EPDR1 to β-actin was quantified and normalized EPDR1 level is demonstrated in the bar graph. Error bars indicate mean with SD and type 2 t test result shows ∗p < 0.001; ∗∗p< 0.0001 compared to Eng+/+ control or as indicated. C, Western blot shows EPDR1 expression upon treatment with insulin (100 nM), TGFβ (200 pM), or BMP9 (1 nM) for 16 h in scramble control and sh-Smad1_2 ECs. Blots of three independent experiments were analyzed by densitometry. Ratio of EPDR1 to β-actin was quantified and normalized EPDR1 level is demonstrated in the bar graph. Error bars indicate mean with SD and type 2 t test result shows ∗p < 0.001; ∗∗p< 0.0001 compared to control (no treatment) or as indicated. EC, endothelial cell; MEEC, mouse embryonic EC.
Figure 6
Figure 6
Insulin-induced EPDR1 expression is required for migration and capillary-like branching in ECs.A, images show scratch-induced migration of Eng+/+ and Eng −/− ECs. Cells were allowed to migrate for 24 h in the presence or absence of insulin. Migration distance is measured in three different ROIs. Graph indicates percentage of migrated cells relative to Eng+/+ control cells based on three independent experiments. Error bars indicate mean with SD and type 2 t test result shows ∗p< 0.0001 compared to Eng+/+ control (no treatment) or as indicated. B, images show scratch-induced migration of scramble control and sh-EPDR1_2 ECs. Cells were allowed to migrate for 16 h in the presence or absence of insulin. Migration distance is measured in three different ROIs. Graph indicates percentage of migrated cells relative to scramble (no treatment) cells based on three independent experiments. Error bars indicate mean with SD and type 2 t test result shows ∗p< 0.00001 compared to scramble (no treatment) or as indicated. C, images show Matrigel-induced capillary-like branching in control, Eng−/−, and sh-EPDR1_2 MEECs at 16 h in the presence or absence of insulin. Graph indicates fold change in number of branches normalized to scramble (no treatment) from triplicates for each of the three independent experiments. The scale bar represents 200 μm. Error bars indicate mean with SD and type 2 t test result shows ∗p< 0.00001 compared to scramble (no treatment) or as indicated. D, a working model of how insulin activates Smad1/5 through the endoglin/ALK1/IR trimeric complex involving Src. This schematic was created with BioRender.com. EC, endothelial cell; MEEC, mouse embryonic EC; ROI, region of interest.

Similar articles

Cited by

References

    1. Gordon K.J., Blobe G.C. Role of transforming growth factor-beta superfamily signaling pathways in human disease. Biochim. Biophys. Acta. 2008;1782:197–228. - PubMed
    1. Blobe G.C., Schiemann W.P., Lodish H.F. Role of transforming growth factor beta in human disease. N. Engl. J. Med. 2000;342:1350–1358. - PubMed
    1. Lebrin F., Goumans M.J., Jonker L., Carvalho R.L., Valdimarsdottir G., Thorikay M., et al. Endoglin promotes endothelial cell proliferation and TGF-beta/ALK1 signal transduction. EMBO J. 2004;23:4018–4028. - PMC - PubMed
    1. Lee N.Y., Golzio C., Gatza C.E., Sharma A., Katsanis N., Blobe G.C. Endoglin regulates PI3-kinase/Akt trafficking and signaling to alter endothelial capillary stability during angiogenesis. Mol. Biol. Cell. 2012;23:2412–2423. - PMC - PubMed
    1. Scharpfenecker M., van Dinther M., Liu Z., van Bezooijen R.L., Zhao Q., Pukac L., et al. BMP-9 signals via ALK1 and inhibits bFGF-induced endothelial cell proliferation and VEGF-stimulated angiogenesis. J. Cell Sci. 2007;120:964–972. - PubMed

MeSH terms