. 2022 Sep;298(9):102294.
doi: 10.1016/j.jbc.2022.102294. Epub 2022 Jul 21.

Prostaglandin F2α and angiotensin II type 1 receptors exhibit differential cognate G protein coupling regulation

Affiliations

Prostaglandin F2α and angiotensin II type 1 receptors exhibit differential cognate G protein coupling regulation

Dana Sedki et al. J Biol Chem. 2022 Sep.

Abstract

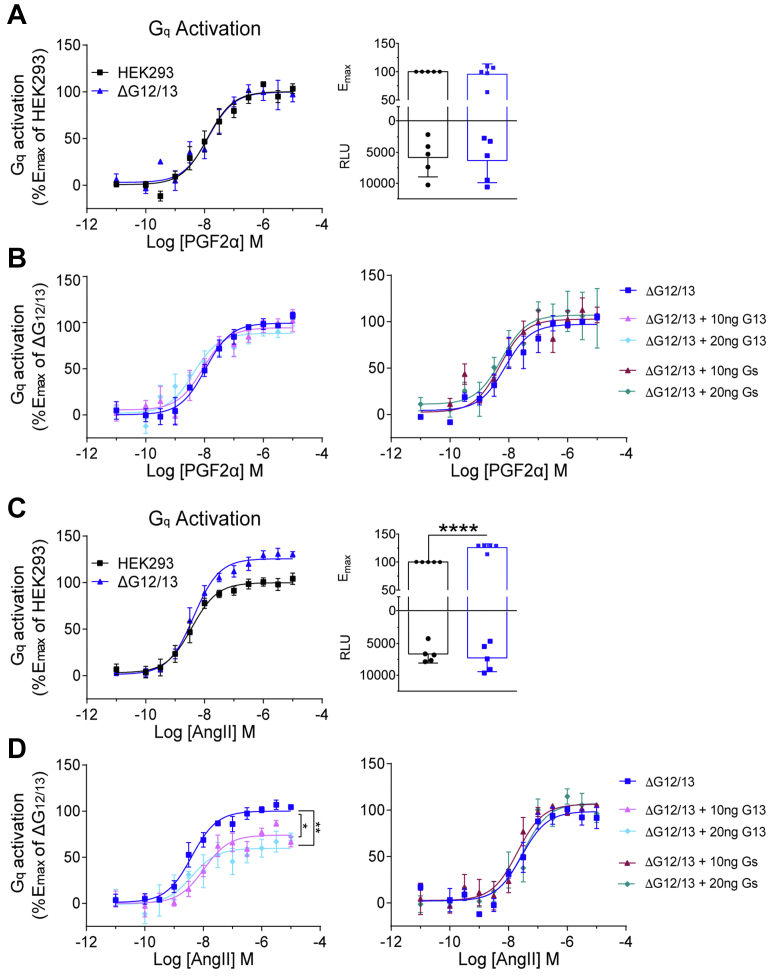
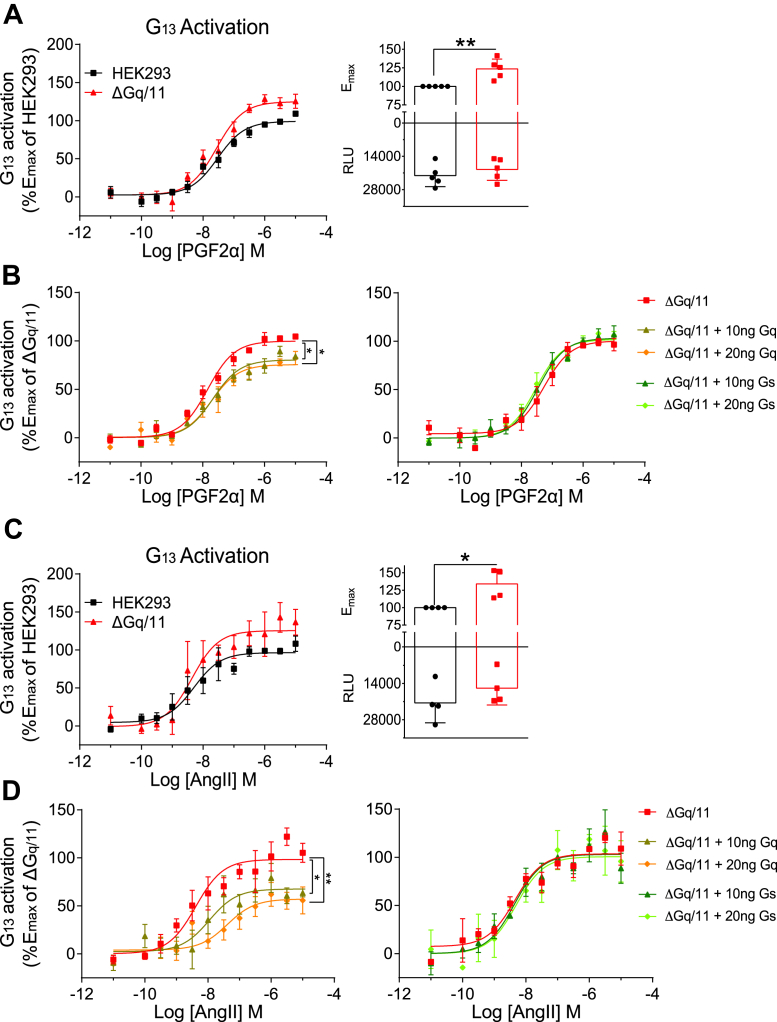
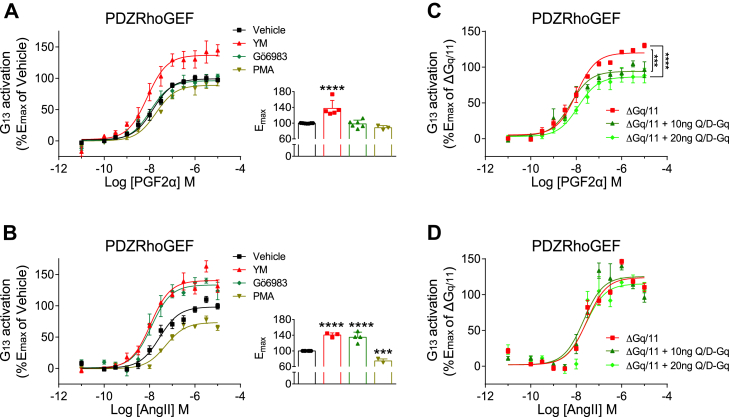
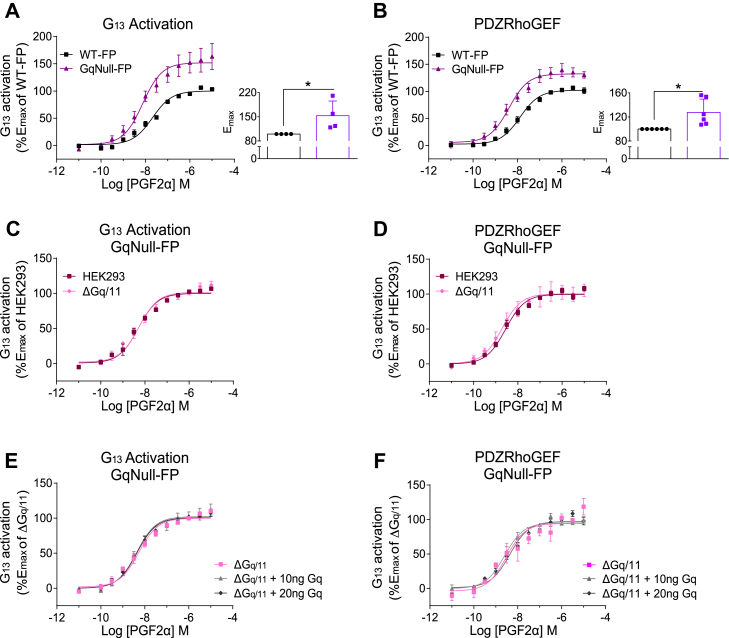
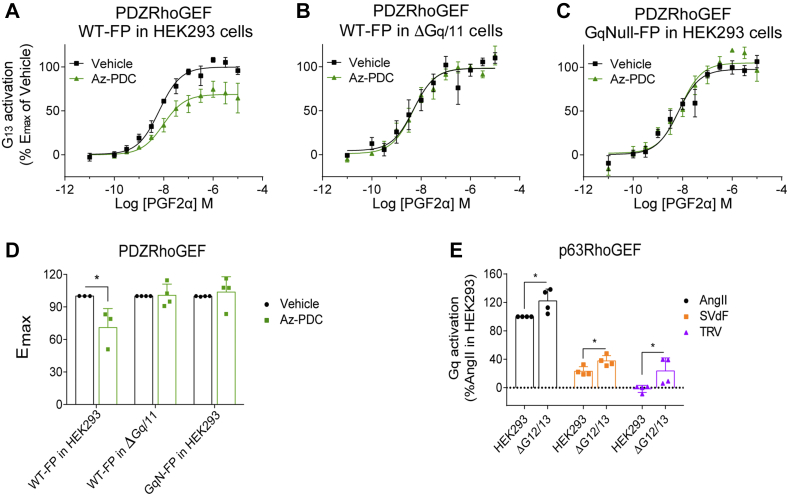
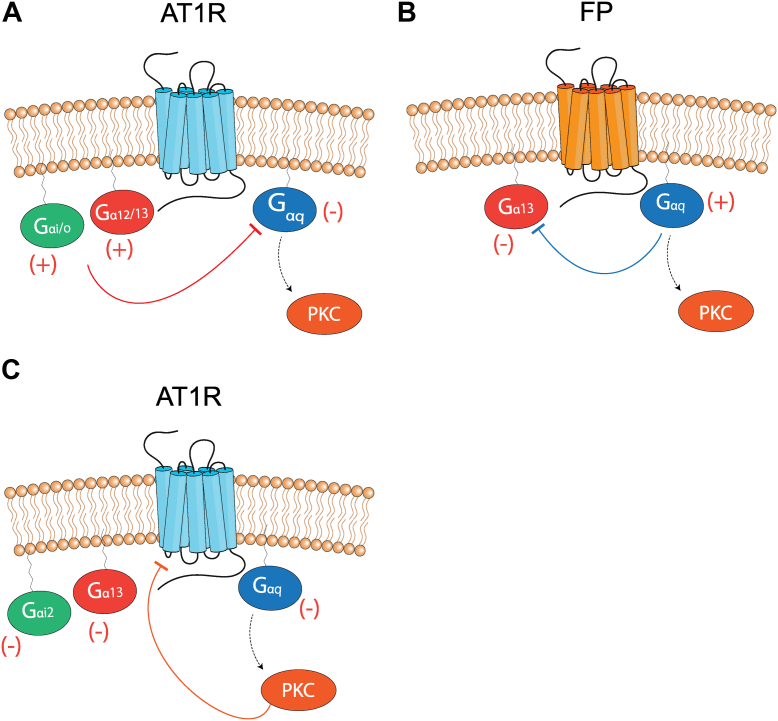
Promiscuous G protein-coupled receptors (GPCRs) engage multiple Gα subtypes with different efficacies to propagate signals in cells. A mechanistic understanding of Gα selectivity by GPCRs is critical for therapeutic design, since signaling can be restrained by ligand-receptor complexes to preferentially engage specific G proteins. However, details of GPCR selectivity are unresolved. Here, we investigated cognate G protein selectivity using the prototypical promiscuous Gαq/11 and Gα12/13 coupling receptors, angiotensin II type I receptor (AT1R) and prostaglandin F2α receptor (FP), bioluminescence resonance energy transfer-based G protein and pathway-selective sensors, and G protein knockout cells. We determined that competition between G proteins for receptor binding occurred in a receptor- and G protein-specific manner for AT1R and FP but not for other receptors tested. In addition, we show that while Gα12/13 competes with Gαq/11 for AT1R coupling, the opposite occurs for FP, and Gαq-mediated signaling regulated G protein coupling only at AT1R. In cells, the functional modulation of biased ligands at FP and AT1R was contingent upon cognate Gα availability. The efficacy of AT1R-biased ligands, which poorly signal through Gαq/11, increased in the absence of Gα12/13. Finally, we show that a positive allosteric modulator of Gαq/11 signaling that also allosterically decreases FP-Gα12/13 coupling, lost its negative modulation in the absence of Gαq/11 coupling to FP. Together, our findings suggest that despite preferential binding of similar subsets of G proteins, GPCRs follow distinct selectivity rules, which may contribute to the regulation of ligand-mediated G protein bias of AT1R and FP.

Keywords: BRET; G protein–coupled receptor; angiotensin II type I receptor; prostaglandin F2α receptor; signaling.


Conflict of interest statement

Conflict of interest Some of the BRET biosensors used in the present study are licensed to Domain Therapeutics for commercial use. The biosensors are freely available under material transfer agreement for academic research and can be requested from S. A. L. All other authors declare that they have no conflicts of interest with the contents of this article.

Figures

Figure 1
Figure 1
Effect of Gα13 availability on Gαq activation by FP and AT1R.AD, Gαq activation following PGF2α stimulation of FP (A and B) or AngII stimulation of AT1R (C and D) assessed by the Gαq polycistronic sensor in HEK293 cells and ΔGα12/13 cells ± Gα13 (B and D, left panels) or Gαs (B and D, right panels) overexpression. BRET measurements are normalized to the maximal response in HEK293 cells (%Emax of HEK293) (A and C) or in ΔGα12/13 cells without Gα overexpression (%Emax of ΔG12/13) (B and D) in the same experiment. A and C insets show the expression levels of Gαq-RlucII (below x-axis) and the Emax values of the dose–response curves (above x-axis). Data information: data are from at least three independent experiments and represent means ± SEM for the dose–response curves or ±SD for scatter plot bar graphs. In A and C, unpaired Student’s t test was performed on the Emax values obtained from the nonlinear regression curves of the average data. ∗∗∗∗p < 0.0001. In B and D, two-way ANOVA followed by Dunnett’s multiple comparisons tests were performed for the last time points. ∗p < 0.05 and ∗∗p < 0.01. AngII, angiotensin II; AT1R, angiotensin II type I receptor; BRET, bioluminescence resonance energy transfer; FP, prostaglandin F2α receptor; HEK293, human embryonic kidney 293 cell line; PGF2α, prostaglandin F2α; RLU, relative light unit.
Figure 2
Figure 2
Effect of Gαq availability on Gα13 activation by FP and AT1R.AD, Gα13 activation following PGF2α stimulation of FP (A and B) or AngII stimulation of AT1R (C and D) assessed by the Gα13 sensor in HEK293 cells and ΔGαq/11 cells ± Gαq (B and D, left panels) or Gαs (B and D, right panels) overexpression. BRET measurements are normalized to the maximal response in HEK293 cells (%Emax of HEK293) (A and C) or in ΔGαq/11 cells without Gα overexpression (%Emax of ΔGq/11) (B and D) in the same experiment. A and C insets show the expression levels of Gα13-RlucII (below x-axis) and the Emax values of the dose–response curves (above x-axis). Data information: data are from at least three independent experiments and represent means ± SEM for the dose–response curves or ±SD for scatter plot bar graphs. In A and C, unpaired Student’s t test was performed on the Emax values obtained from the nonlinear regression curves of the average data. ∗p < 0.05, and ∗∗p < 0.01. In B and D, two-way ANOVA followed by Dunnett’s multiple comparisons tests were performed for the last time points. ∗p < 0.05, and ∗∗p < 0.01. AngII, angiotensin II; AT1R, angiotensin II type I receptor; BRET, bioluminescence resonance energy transfer; FP, prostaglandin F2α receptor; HEK293, human embryonic kidney 293 cell line; PGF2α, prostaglandin F2α; RLU, relative light unit.
Figure 3
Figure 3
Impact of Gαq downstream signaling on Gα13 activation by FP and AT1R.AD, Gα13-mediated PDZRhoGEF PM recruitment by FP (A and C) or AT1R (B and D) either in HEK293 cells treated with vehicle, 200 nM YM-254890 (YM), 1 μM Gö6983, or 1 μM PMA for 30 min (A and B) or in ΔGαq/11 cells ± inactive Gαq mutant (Q/D-Gαq) overexpression (C and D). Cells were stimulated with the indicated concentrations of PGF2α (A and C) or AngII (B and D). BRET measurements are normalized to the maximal response of vehicle-treated cells (%Emax of vehicle) (A and B) or in ΔGαq/11 cells without Q/D-Gαq expression (%Emax of ΔGq/11) in the same experiment. Data information: data are from at least three independent experiments and represent means ± SEM for the dose–response curves or ±SD for scatter plot bar graphs. In A and B, one-way ANOVA followed by Dunnett’s multiple comparison test was performed on Emax values obtained from the nonlinear regression curves of the averaged data. ∗∗∗p < 0.001, and ∗∗∗∗p < 0.0001. In C and D, two-way ANOVA followed by Dunnett’s multiple comparisons tests were performed for the last time points. ∗∗∗p < 0.001 and ∗∗∗∗p < 0.0001. AngII, angiotensin II; AT1R, angiotensin II type I receptor; BRET, bioluminescence resonance energy transfer; FP, prostaglandin F2α receptor; HEK293, human embryonic kidney 293 cell line; PM, plasma membrane; PGF2α, prostaglandin F2α; PMA, phorbol 12-myristate 13-acetate.
Figure 4
Figure 4
Impact of Gαq availability on Gα13 signaling by the GαqNull mutant FP.AF, Gα13 activation assessed by the Gα13 sensor (A, C, and E), or by Gα13-mediated PDZRhoGEF PM translocation (B, D, and F) following PGF2α stimulation of WT-FP or GαqNull mutant FP (GαqNull-FP) in HEK293 cells (A and B) or of GαqNull-FP in HEK293 cells and ΔGαq/11 cells ± Gαq overexpression (CF). BRET measurements are normalized to the maximal response of WT-FP (%Emax of WT-FP) (A and B) or of GαqNull-FP in ΔGαq/11 cells without Gαq expression (%Emax of ΔGq/11) in the same experiment. Data information: data are from at least three independent experiments and represent means ± SEM for the dose–response curves or ±SD for scatter plot bar graphs. In A and B, unpaired Student’s t test was performed on Emax values obtained from the nonlinear regression curve of the averaged data. ∗p < 0.05. BRET, bioluminescence resonance energy transfer; FP, prostaglandin F2α receptor; HEK293, human embryonic kidney 293 cell line; PGF2α, prostaglandin F2α; PM, plasma membrane.
Figure 5
Figure 5
Modulation of FP and AT1R-biased ligands with altered receptor G protein–binding availability.AC, Gα13-mediated PDZRhoGEF PM recruitment upon PGF2α stimulation of WT-FP (A and B) or GαqNull mutant FP (GαqNull-FP) (C) in parental HEK293 cells (A and C) or in ΔGαq/11 cells (B). Cells were pretreated with vehicle or 10 μM Az-PDC for 30 min prior to PGF2α stimulation with the indicated concentrations. BRET measurements are normalized to the maximal response in the vehicle-treated condition (%Emax of vehicle). D, bar graph representation of Emax values of the dose–response curves from AC. E, Gαq-mediated p63RhoGEF PM recruitment upon AT1R stimulation in HEK293 cells or in ΔGα12/13 cells. Cells were stimulated with 10 μM of AngII, TRV, or SVdF. BRET measurements are normalized to the response of AngII (%Emax of AngII). Data information: data are from at least three independent experiments and represent means ± SEM for the dose–response curves or ±SD for scatter plot bar graphs. In D and E, unpaired Student’s t tests were performed. ∗p < 0.05. AngII, angiotensin II; AT1R, angiotensin II type I receptor; BRET, bioluminescence resonance energy transfer; FP, prostaglandin F2α receptor; HEK293, human embryonic kidney 293 cell line; PGF2α, prostaglandin F2α; PM, plasma membrane.
Figure 6
Figure 6
Schematic representation of FP and AT1R selectivity regulation by G protein competitive coupling and/or signaling.A and B, G proteins compete for receptor binding in a receptor-dependent fashion. For AT1R, Gαi2 and Gα12/13 binding restricts Gαq coupling and activation (A), whereas for FP, Gαq binding impedes Gα13 coupling and activation (B). C, Gαq, Gα13, and Gαi2 coupling to AT1R is regulated by PKC downstream of Gαq. AT1R, angiotensin II type I receptor; FP, prostaglandin F2α receptor.

Similar articles

Cited by

References

    1. Wettschureck N., Offermanns S. Mammalian G proteins and their cell type specific functions. Physiol. Rev. 2005;85:1159–1204. - PubMed
    1. Shenoy S.K., Lefkowitz R.J. beta-Arrestin-mediated receptor trafficking and signal transduction. Trends Pharmacol. Sci. 2011;32:521–533. - PMC - PubMed
    1. Slosky L.M., Caron M.G., Barak L.S. Biased allosteric modulators: new frontiers in GPCR drug discovery. Trends Pharmacol. Sci. 2021;42:283–299. - PMC - PubMed
    1. Khoury E., Clement S., Laporte S.A. Allosteric and biased g protein-coupled receptor signaling regulation: potentials for new therapeutics. Front. Endocrinol. (Lausanne) 2014;5:68. - PMC - PubMed
    1. Flock T., Hauser A.S., Lund N., Gloriam D.E., Balaji S., Babu M.M. Selectivity determinants of GPCR-G-protein binding. Nature. 2017;545:317–322. - PMC - PubMed

MeSH terms

Substances

LinkOut - more resources