. 2022 Dec;236(5):1888-1907.
doi: 10.1111/nph.18395. Epub 2022 Sep 2.

The DNA methylation landscape of the root-knot nematode-induced pseudo-organ, the gall, in Arabidopsis, is dynamic, contrasting over time, and critically important for successful parasitism

Affiliations

The DNA methylation landscape of the root-knot nematode-induced pseudo-organ, the gall, in Arabidopsis, is dynamic, contrasting over time, and critically important for successful parasitism

Ana Cláudia Silva et al. New Phytol. 2022 Dec.

Abstract

Root-knot nematodes (RKNs) induce giant cells (GCs) within galls which are characterized by large-scale gene repression at early stages. However, the epigenetic mechanism(s) underlying gene silencing is (are) still poorly characterized. DNA methylation in Arabidopsis galls induced by Meloidogyne javanica was studied at crucial infection stages (3 d post-infection (dpi) and 14 dpi) using enzymatic, cytological, and sequencing approaches. DNA methyltransferase mutants (met1, cmt2, cmt3, cmt2/3, drm1/2, ddc) and a DNA demethylase mutant (ros1), were analyzed for RKN resistance/tolerance, and galls were characterized by confocal microscopy and RNA-seq. Early galls were hypermethylated, and the GCs were found to be the major contributors to this hypermethylation, consistent with the very high degree of gene repression they exhibit. By contrast, medium/late galls showed no global increase in DNA methylation compared to uninfected roots, but exhibited large-scale redistribution of differentially methylated regions (DMRs). In line with these findings, it was also shown that DNA methylation and demethylation mutants showed impaired nematode reproduction and gall/GC-development. Moreover, siRNAs that were exclusively present in early galls accumulated at hypermethylated DMRs, overlapping mostly with retrotransposons in the CHG/CG contexts that might be involved in their repression, contributing to their stability/genome integrity. Promoter/gene methylation correlated with differentially expressed genes encoding proteins with basic cell functions. Both mechanisms are consistent with reprogramming host tissues for gall/GC formation. In conclusion, RNA-directed DNA methylation (RdDM; DRM2/1) pathways, maintenance methyltransferases (MET1/CMT3) and demethylation (ROS1) appear to be prominent mechanisms driving a dynamic regulation of the epigenetic landscape during RKN infection.

Keywords: Meloidogyne javanica; Arabidopsis; DNA methylation/epigenetics signatures; galls; giant cells; siRNAs; tomato; transposons.


Figures

Fig. 1
Fig. 1
Global DNA methylation in Arabidopsis galls induced by Meloidogyne javanica. (a) Global 5‐methylcytosine (5‐mC) DNA methylation (in percentage terms) in galls and uninfected root segments (controls; RCs) at 3 and 14 d post‐infection (dpi), quantified using an ELISA‐based kit. (b) Global percentage of methylated cytosines (quantified using MethylC sequencing (MethylC‐seq)) in the same samples. (c, d) Global percentage of methylated cytosines (via MethylC‐seq) in galls at 3 dpi (c) and 14 dpi (d) and RCs in the three different methylation contexts (CG, CHG and CHH). Values are means from three independent biological samples (see Methods S1; ‘RNA and DNA extraction and purification’ sub‐section) and error bars denote ±SE. P‐values are indicated (one‐tailed Student's t‐test; n = 3).
Fig. 2
Fig. 2
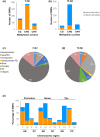
Distribution of differentially methylated regions (DMRs; methylation difference > 15%) in galls induced by Meloidogyne javanica. (a, b) Differentially methylated regions identified in the three methylation contexts (CG, CHG and CHH) at 3 d post‐infection (dpi) (a) and 14 dpi (b). (c, d) Percentages of different genomic regions (genes, promoters, transposable elements (TEs) and intergenic regions) overlapping with the identified DMRs at 3 dpi (c) and 14 dpi (d). (e) Classification of DMRs overlapping promoters, genes and TEs according to their chromosomic location at pericentromeric regions (PC) or chromosome arms (AR). In all cases, hypermethylation is shown in orange and hypomethylation in blue.
Fig. 3
Fig. 3
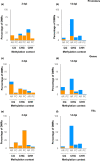
Classification of differentially methylated regions (DMRs; methylation difference > 15%) according to methylation contexts, chromosome location and genomic regions. (a–f) Classification of DMRs overlapping promoters (a, b), genes (c, d) and transposable elements (TEs) (e, f) according to their chromosomic location at pericentromeric regions (PC) or chromosome arms (AR), as well as by methylation context (CG, CHG or CHH) at 3 d post‐infection (dpi) (a, c, e) and 14 dpi (b, d, f). In all cases, hypermethylation is shown in orange and hypomethylation in blue.
Fig. 4
Fig. 4
Classification of differentially methylated regions (DMRs; methylation difference > 15%) overlapping transposable elements (TEs). Differentially methylated regions overlapping TEs were classified into those that only overlapped TEs (‘Only TEs’) and those that also overlapped promoters (‘Promoters/TEs’). (a–d) Percentages of DMRs overlapping Only TEs (a, b) and Promoters/TEs (c, d) that map to class I (retrotransposons) and class II (DNA TEs) TEs, at 3 d post‐infection (dpi) (a, c) and 14 dpi (b, d). (e–h) Percentages of DMRs overlapping Only TEs (e, f) and Promoters/TEs (g, h) that map to different transposon superfamilies of class I (COPIA, GYPSY, LINE and SINE; Slotkin & Martienssen, ; Buisine et al., 2008) and class II (MUTATOR, EnSPm/CACTA, hAT, PIF‐HARBINGER, POGO, Tc‐MARINER and HELITRON; Underwood et al., 2017), at 3 dpi (e, g) and 14 dpi (f, h). In all cases, hypermethylation is shown in orange and hypomethylation in blue. Transposons not included in these superfamilies were categorized as ‘other class I’, ‘other class II’ or ‘unassigned’. The inclusion of RathE1_cons and RathE2_cons as a retrotransposon was considered following the work of Buisine et al. (2008).
Fig. 5
Fig. 5
Arabidopsis mutants impaired in methyltransferases and DNA demethylase ROS1 are more resistant to root‐knot nematode infection than control plants. (a–d) Infection tests with Meloidogyne javanica showing the number of galls formed in mutant lines (cmt3, drm1/drm2, ddc, ros1, met1, cmt2 and cmt2/3) per primary root following Olmo et al. (2017) compared with the control Col‐0 plants (n ≥ 111 plants/line). (e) Gall diameter (blue dots; n ≥ 25 galls/line) at 14 d post‐infection relative to that of Col‐0 (the red dotted line indicates the 100% value on the y‐axis). (f, g) Nematode reproduction parameters in the mutants relative to Col‐0 in soil (n ≥ 7), number of females and number of egg masses per root weight (in grams; f) and total number of eggs per root weight (in grams; g). Asterisks represent significant differences from Col‐0 control values according to Student’s t‐test (*, P < 0.05; **, P < 0.01; ***, P < 0.001). Values are means ± SE.
Fig. 6
Fig. 6
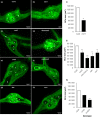
Arabidopsis mutants impaired in methyltransferases and DNA demethylase ROS1 showed altered feeding site development compared to control plants. (a–h) Confocal micrographs of galls formed by Meloidogyne javanica in different methylase mutants: met1 (b), cmt3 (c), drm1/drm2 (d), cmt2 (e), cmt2/3 (f), ddc (g) and ros1 (h), as compared to Col‐0 (a). (i–k) The average size of the giant cells (GCs) within a gall in met1 and Col‐0 (i), cmt3, drm1/drm2, ddc, ros1 and Col‐0 (j) and cmt2, cmt2/3 and Col‐0 (k) (n ≥ 4 galls per line; 5 sections per gall). Asterisks represent significant differences in the GC sizes (μm2) of met1, cmt3, cmt2/3, drm1/drm2, ddc and ros1 compared to Col‐0, according to Student’s t‐test (**, P < 0.01; ***, P < 0.001). Values are means ± SE. Bars: (a–d, g, h) 100 μm; (e, f) 75 μm. N, nematode. GCs are labelled with a white asterisk. Confocal microscopy was performed using a Leica TCS SP8 laser scanning confocal microscope (Leica, Wetzlar, Germany).
Fig. 7
Fig. 7
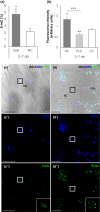
DNA methylation in Solanum lycopersicum galls and giant cells (GCs) at early stages of infection (2–7 d post‐infection; dpi). (a) Global 5‐methylcytosine (5‐mC) DNA methylation (in percentage) in galls and uninfected control root segments (RCs), quantified using an ELISA‐based kit (see the Materials and Methods section; ‘Quantification of global 5‐methylcytosine’ sub‐section). (b) Quantification of the 5‐mC immunofluorescence signal calculated for the nuclei of GCs, the proliferative cells (PLCs) formed within the gall and the vascular cylinder cells (VCs) of the RCs. In the histogram, immunofluorescence intensity is shown in arbitrary units, calculated from confocal microscopy maximum projection images (see the Materials and Methods section; ‘Immunofluorescence and confocal microscopy’ sub‐section). Values are means ± SE (‘n’ indicates number of nuclei; GCs, n = 43; PLCs, n = 57; VCs, n = 78). (c–c′′, d–d′′) Representative micrographs of 5‐mC immunofluorescence in control vascular cylinder cells (c, c′ and c′′) and infected roots (d, d′ and d′′); Nomarski's differential interference contrast (DIC) images show the cellular organization of the different tissues (c, d). Confocal micrographs for 4′,6‐diamidino‐2‐phenylindole (DAPI) staining (blue) (c′, d′) and the 5‐mC immunofluorescence signal from the nuclei (green) (c′′, d′′). A giant cell nucleus (right) and vascular cell nucleus (left) are highlighted in each image. In (c) and (d), VCs, PLCs and a GC are also indicated. Bars: (c–c′′) 50 μm; (d–d′′) 25 μm. Asterisks in (a) and (b) indicate significant differences according to Student’s t‐test ((a); n = 8) or the Kruskal–Wallis nonparametric test followed by Dunn's post hoc test (b) (*, P < 0.05; **, P < 0.01 and ***, P < 0.001). Confocal microscopy was performed using a Leica TCS‐SP5‐AOBS.
Fig. 8
Fig. 8
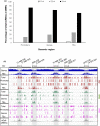
Distribution of differentially methylated regions (DMRs; methylation difference > 15%) and siRNAs overlapping promoters, genes and transposable elements (TEs) along the Arabidopsis chromosomes. (a) Classification of siRNAs exclusive to galls and not present in control roots (eGall‐siRNAs) that match DMRs overlapping promoters, genes and TEs according to nucleotide (nt) length: white, 21‐nt; grey, 22‐nt; black, 24‐nt. (b) The Arabidopsis genome is shown as a continuum of the five chromosomes (Chr). Arabidopsis chromosomes are classified into three regions: centromere (CEN), pericentromeric region (PC) and chromosome arm regions (AR). Pericentromeric regions are defined as regions in which the gene coverage in 1 Mb is ≤ 40%. The DMRs matching genes and TEs according to TAIR10 are shown in blue, and the pericentromeric regions (PCs) are highlighted with light grey bands for the five Arabidopsis chromosomes. The DMRs overlapping promoters, genes and TEs identified in each methylation context are coloured as follows: brown, CG; green, CHG; magenta, CHH. The differentially accumulated eGall‐siRNAs (P < 0.05) are shown in grey at the bottom of the figure.

Similar articles

Cited by

References

    1. Absmanner B, Stadler R, Hammes UZ. 2013. Phloem development in nematode‐induced feeding sites: the implications of auxin and cytokinin. Frontiers in Plant Science 4: 241. - PMC - PubMed
    1. Akalin A, Kormaksson M, Li S, Garrett‐Bakelman FE, Figueroa ME, Melnick A, Mason CE. 2012. MethylKit: a comprehensive R package for the analysis of genome‐wide DNA methylation profiles. Genome Biology 13: R87. - PMC - PubMed
    1. de Almeida Engler EJ, Gheysen G. 2013. Nematode‐induced endoreduplication in plant host cells: why and how? Molecular Plant–Microbe Interactions 26: 17–24. - PubMed
    1. de Almeida Engler J, Vieira P, Rodiuc N, Grossi de Sa MF, Engler G. 2015. The plant cell cycle machinery: usurped and modulated by plant‐parasitic nematodes. Advances in Botanical Research 73: 91–118.
    1. Atighi MR, Verstraeten B, De Meyer T, Kyndt T. 2020. Genome‐wide DNA hypomethylation shapes nematode pattern‐triggered immunity in plants. New Phytologist 227: 545–558. - PMC - PubMed

Publication types

MeSH terms

Substances

Associated data