

Engineering Modular 3D Liver Culture Microenvironments In Vitro to Parse the Interplay between Biophysical and Biochemical Microenvironment Cues on Hepatic Phenotypes
- PMID: 35872804
- PMCID: PMC9307216
- DOI: 10.1002/anbr.202100049
Engineering Modular 3D Liver Culture Microenvironments In Vitro to Parse the Interplay between Biophysical and Biochemical Microenvironment Cues on Hepatic Phenotypes
Abstract
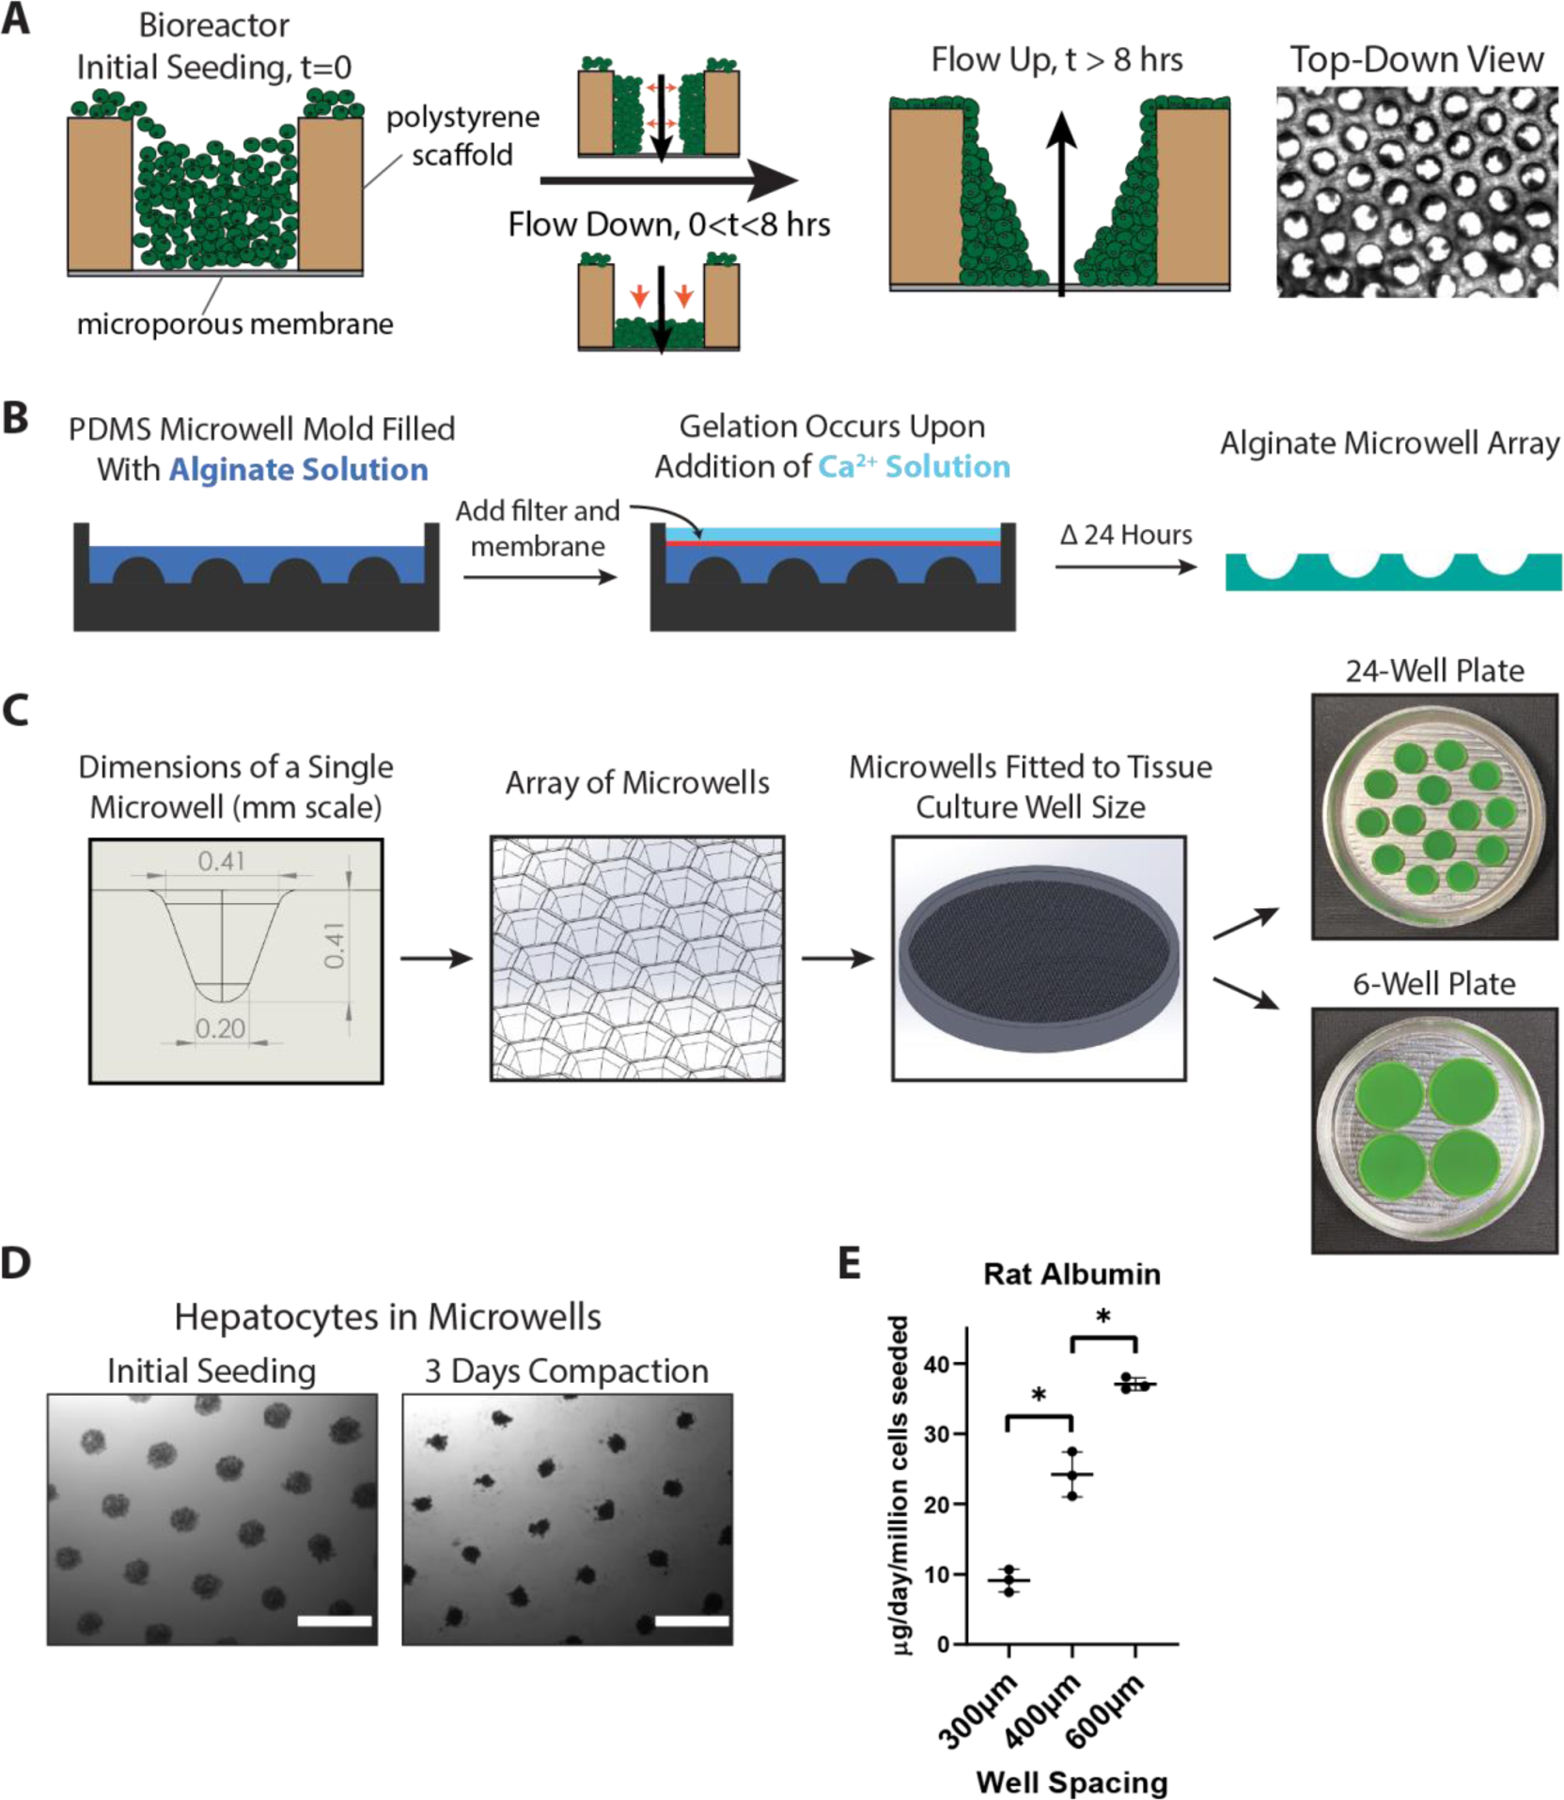
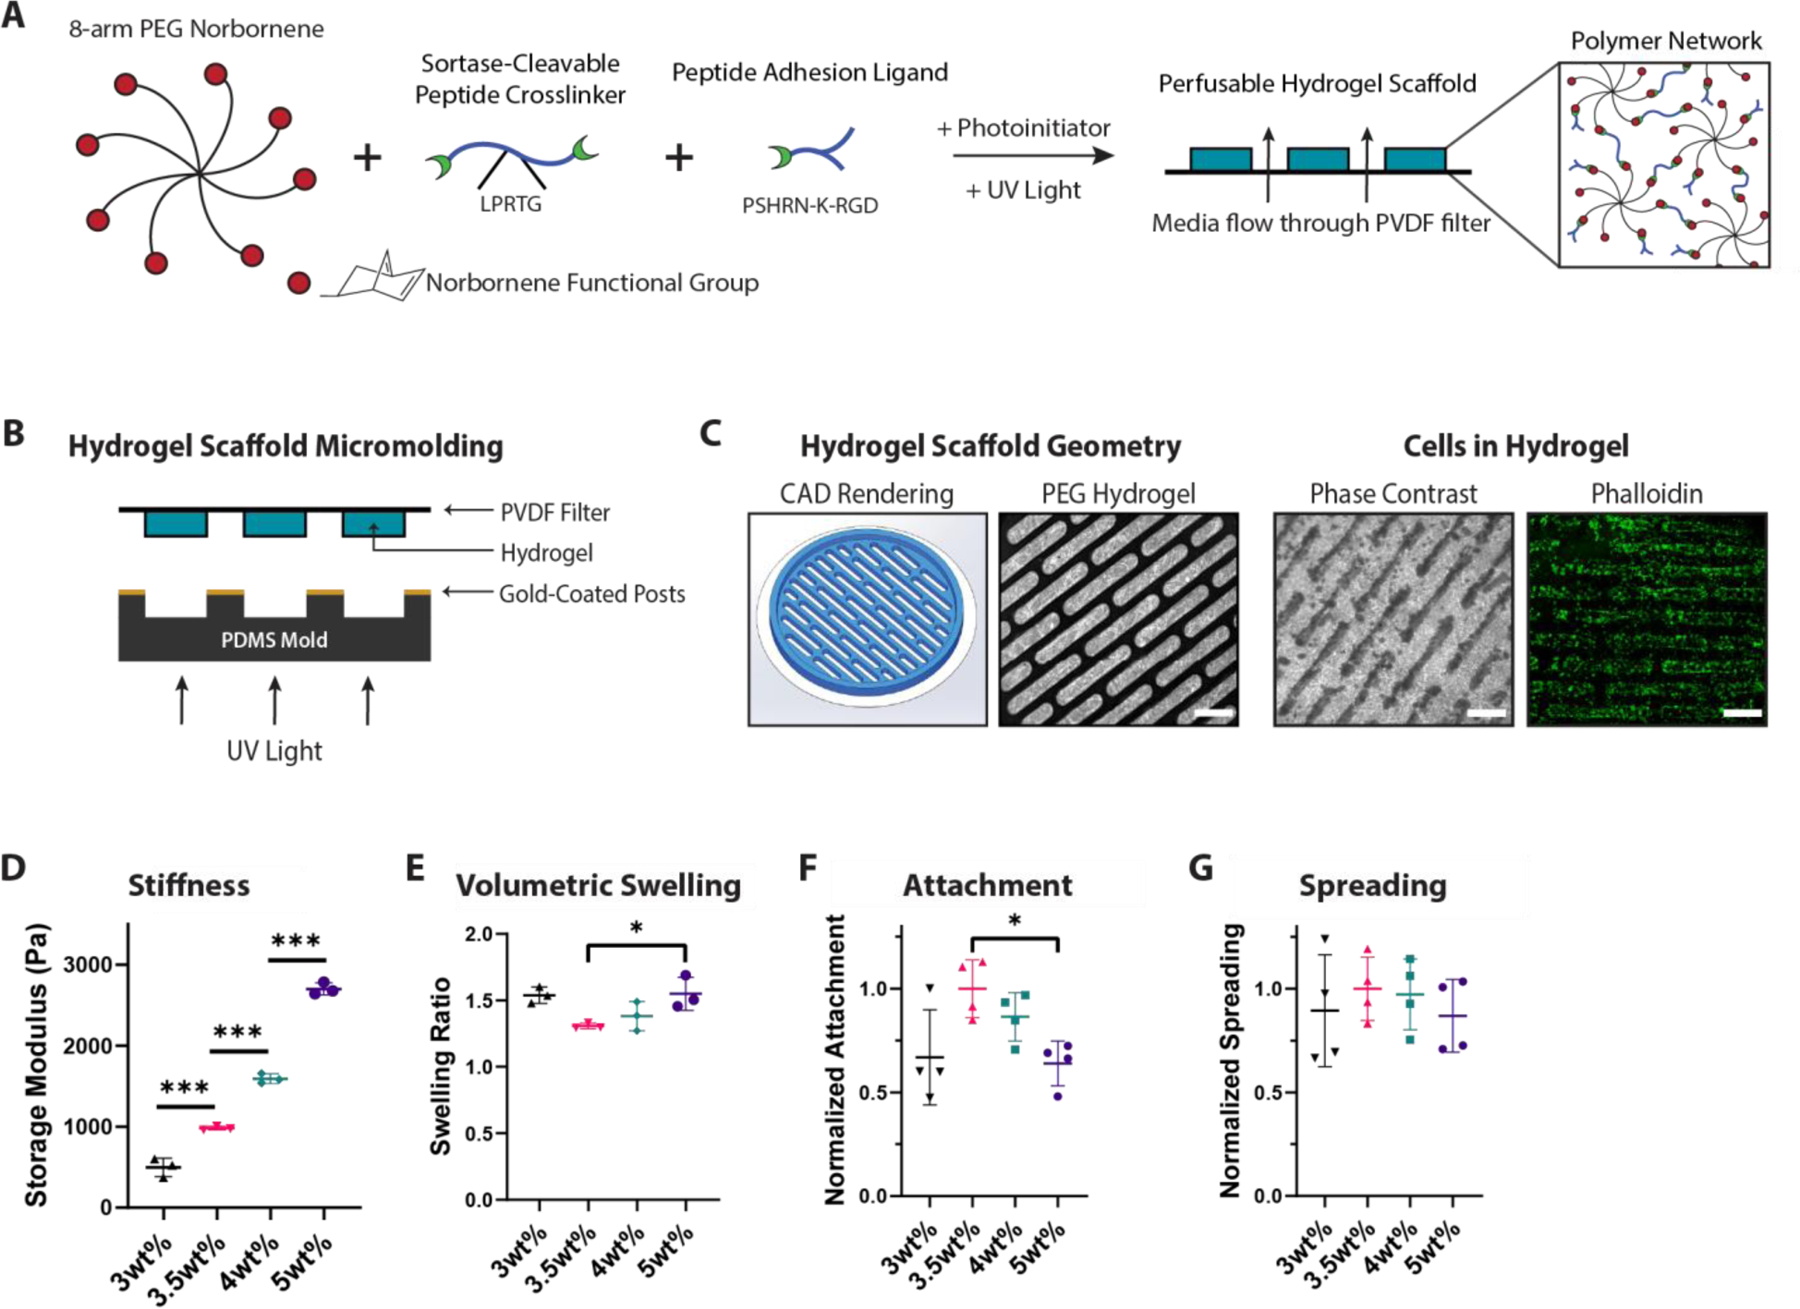
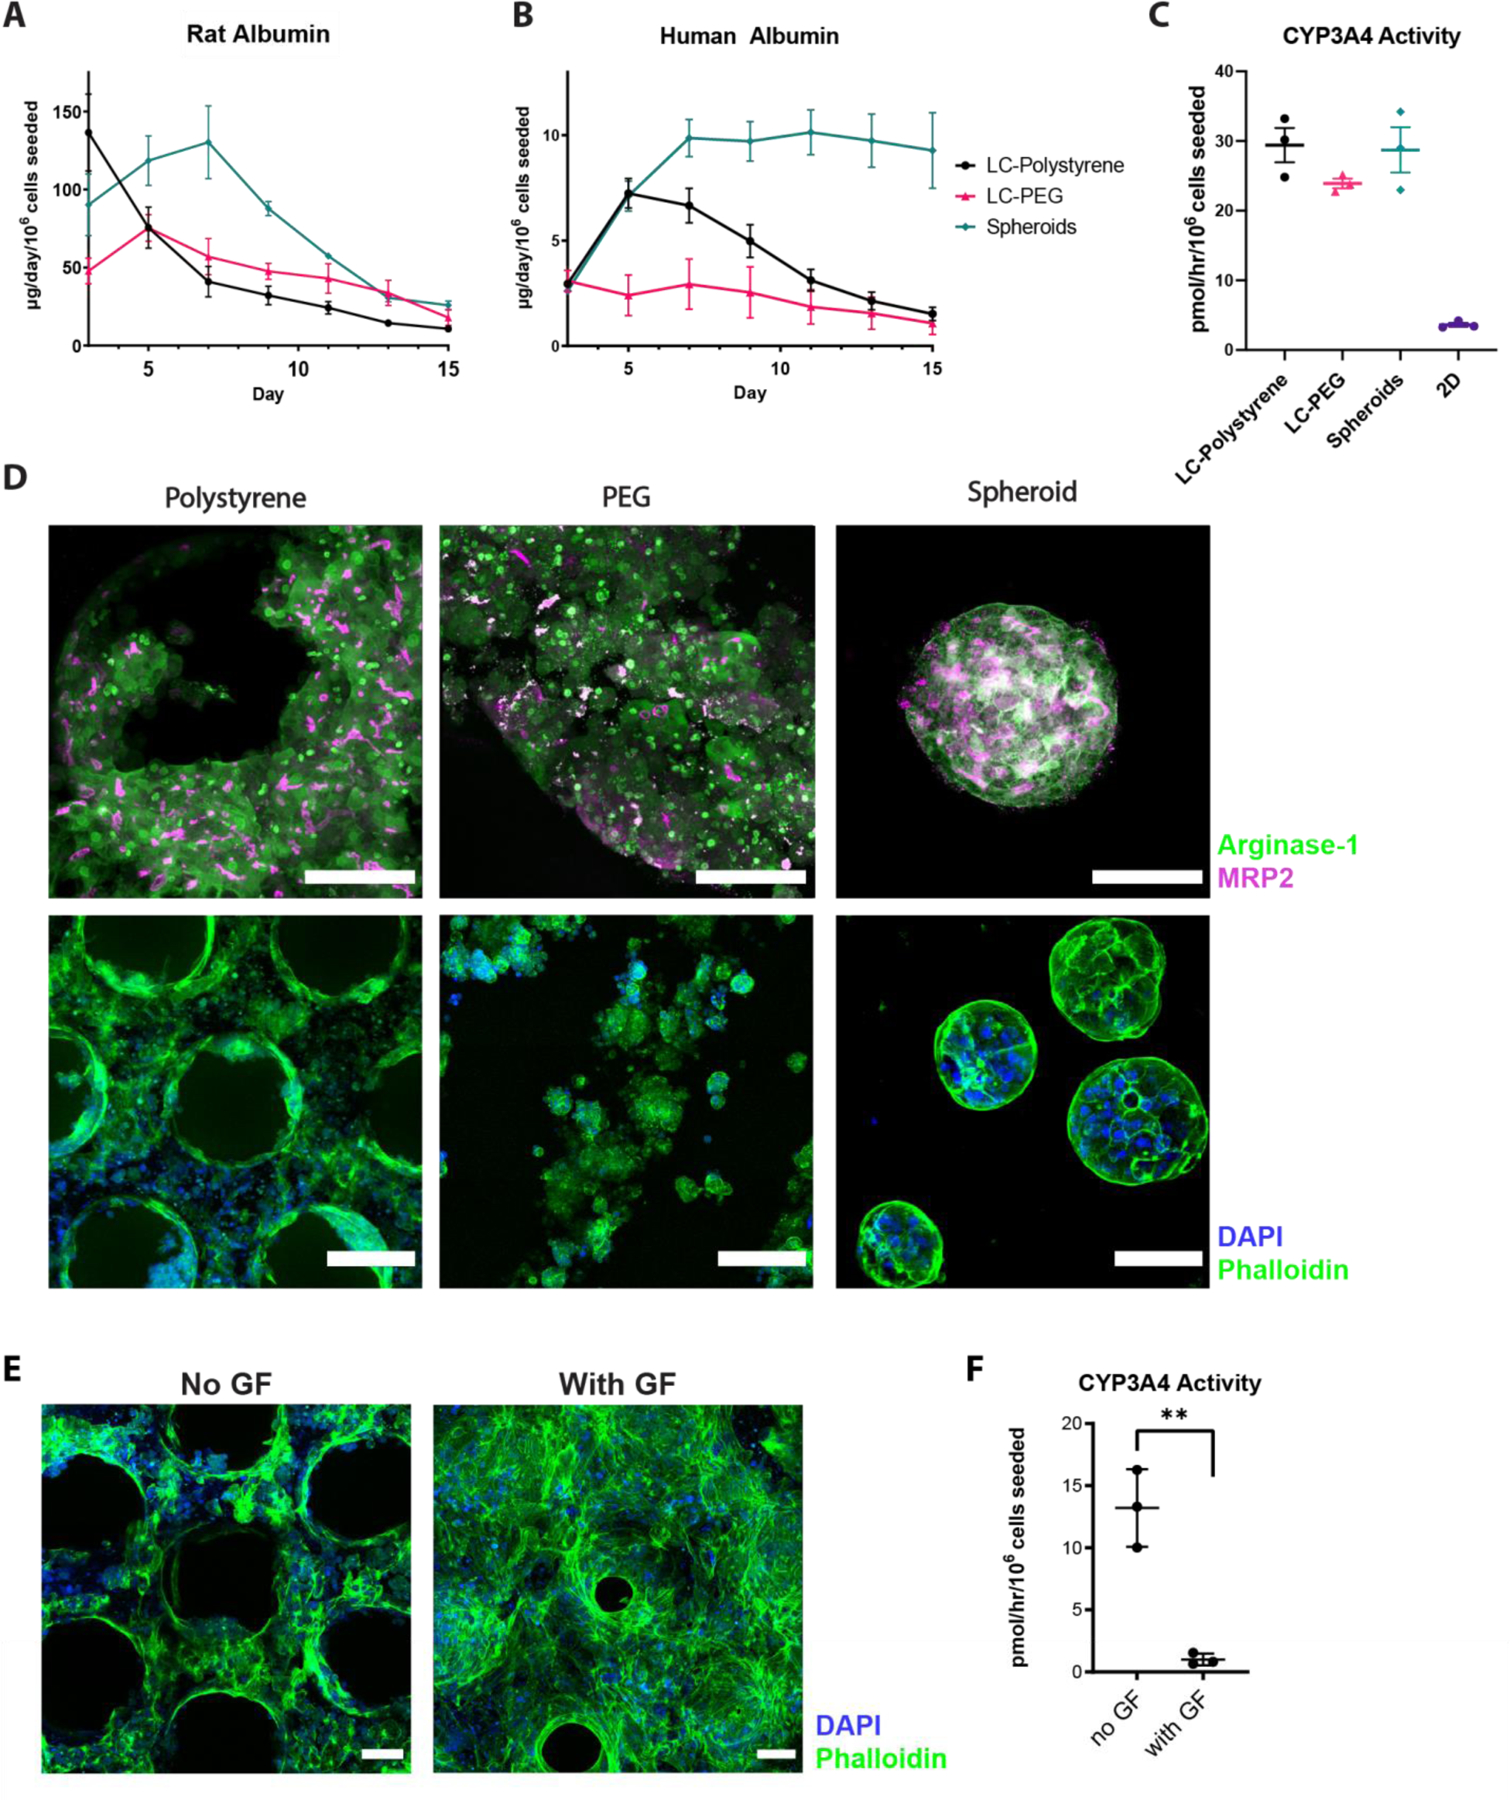
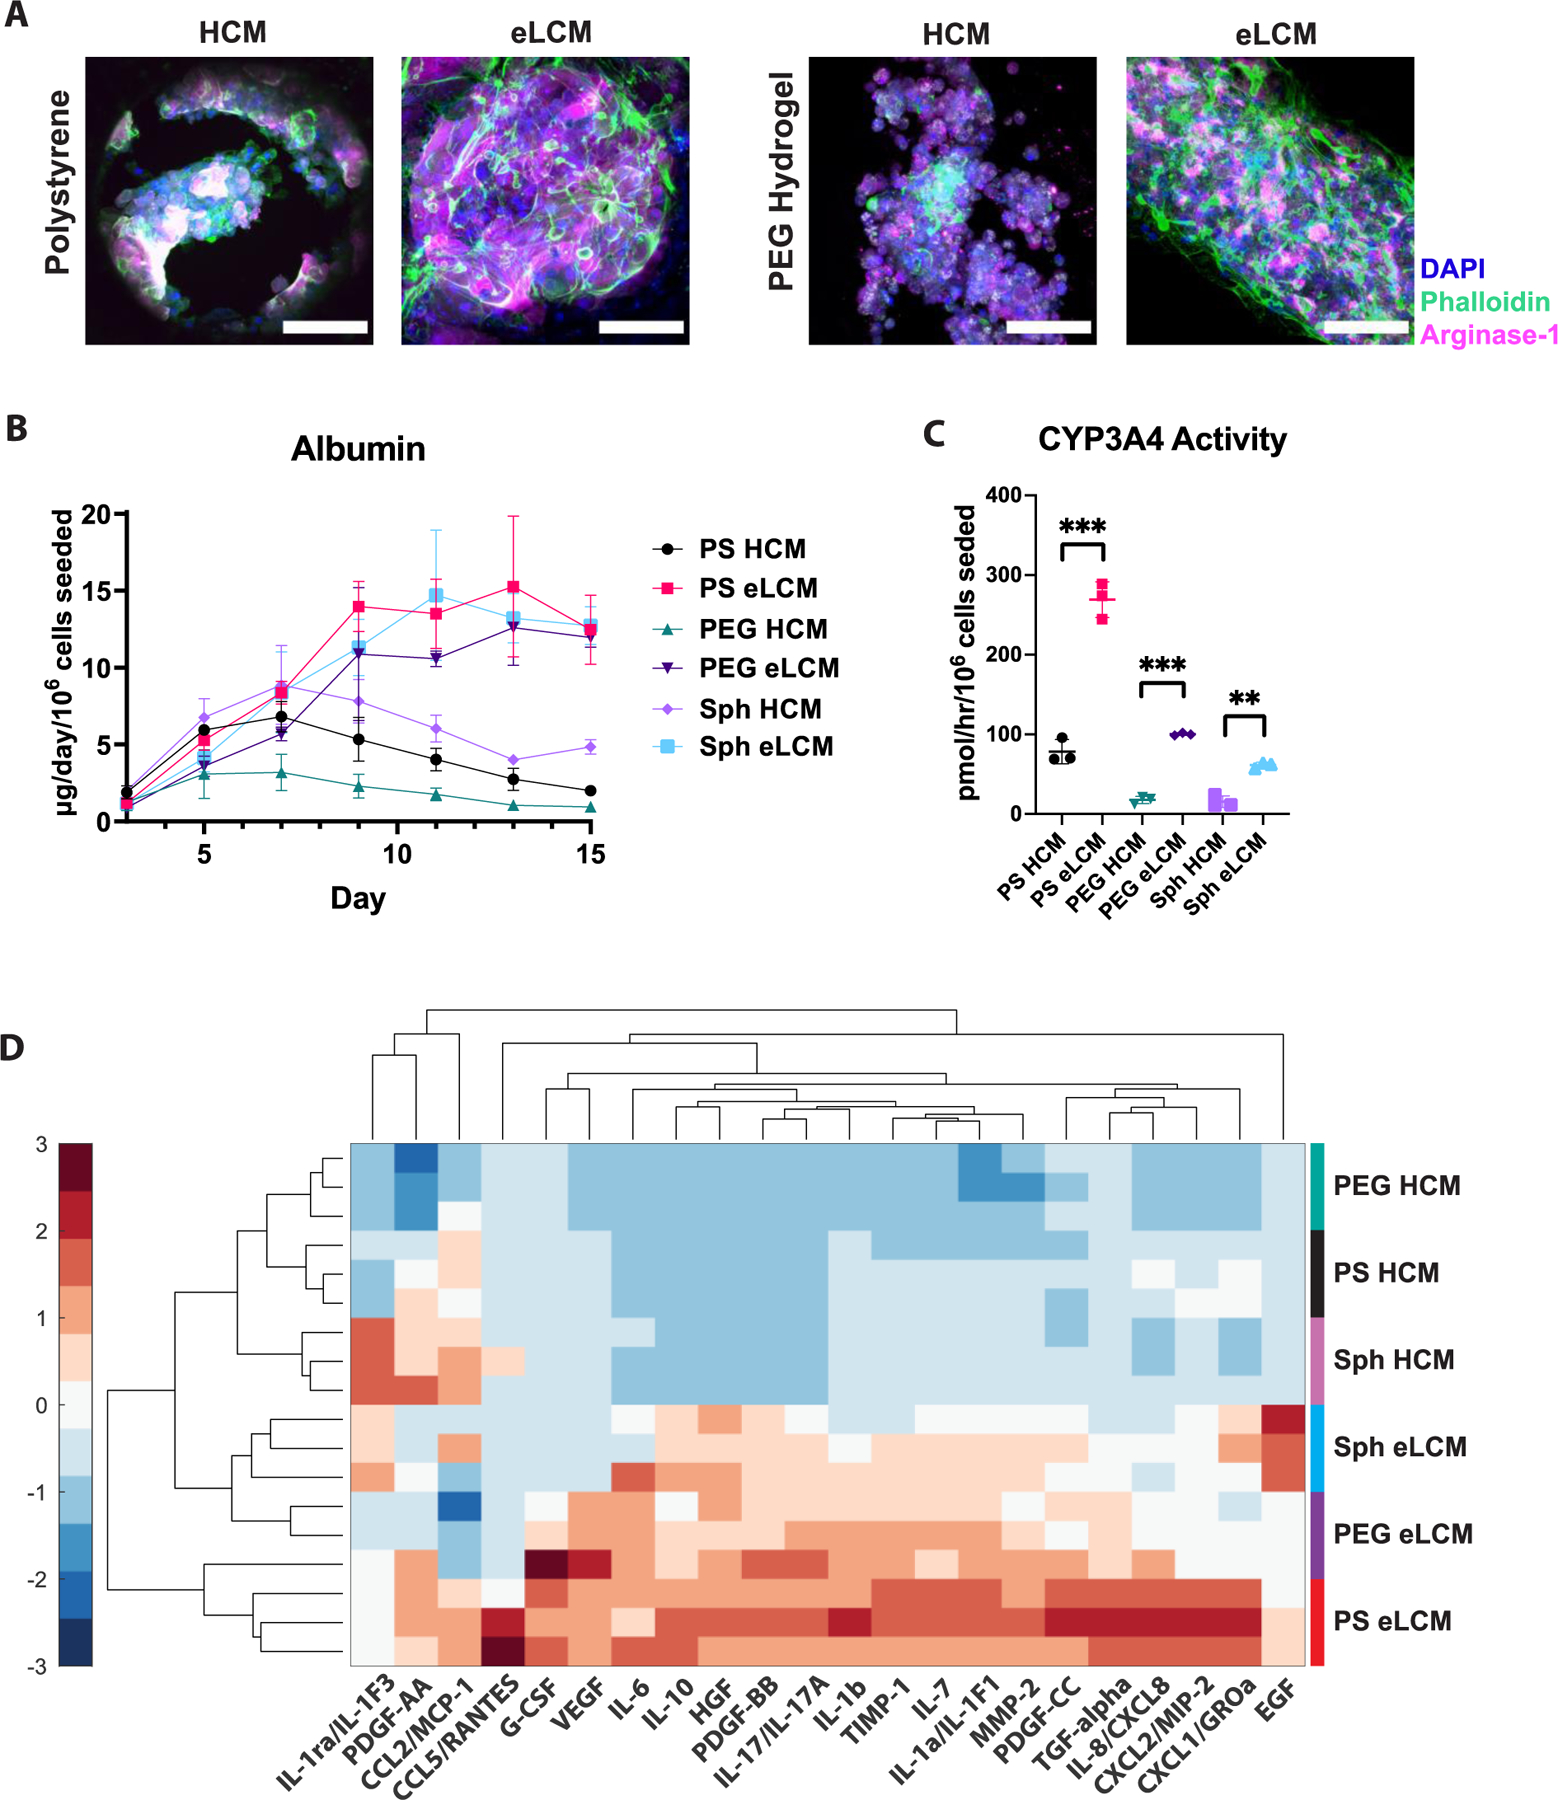
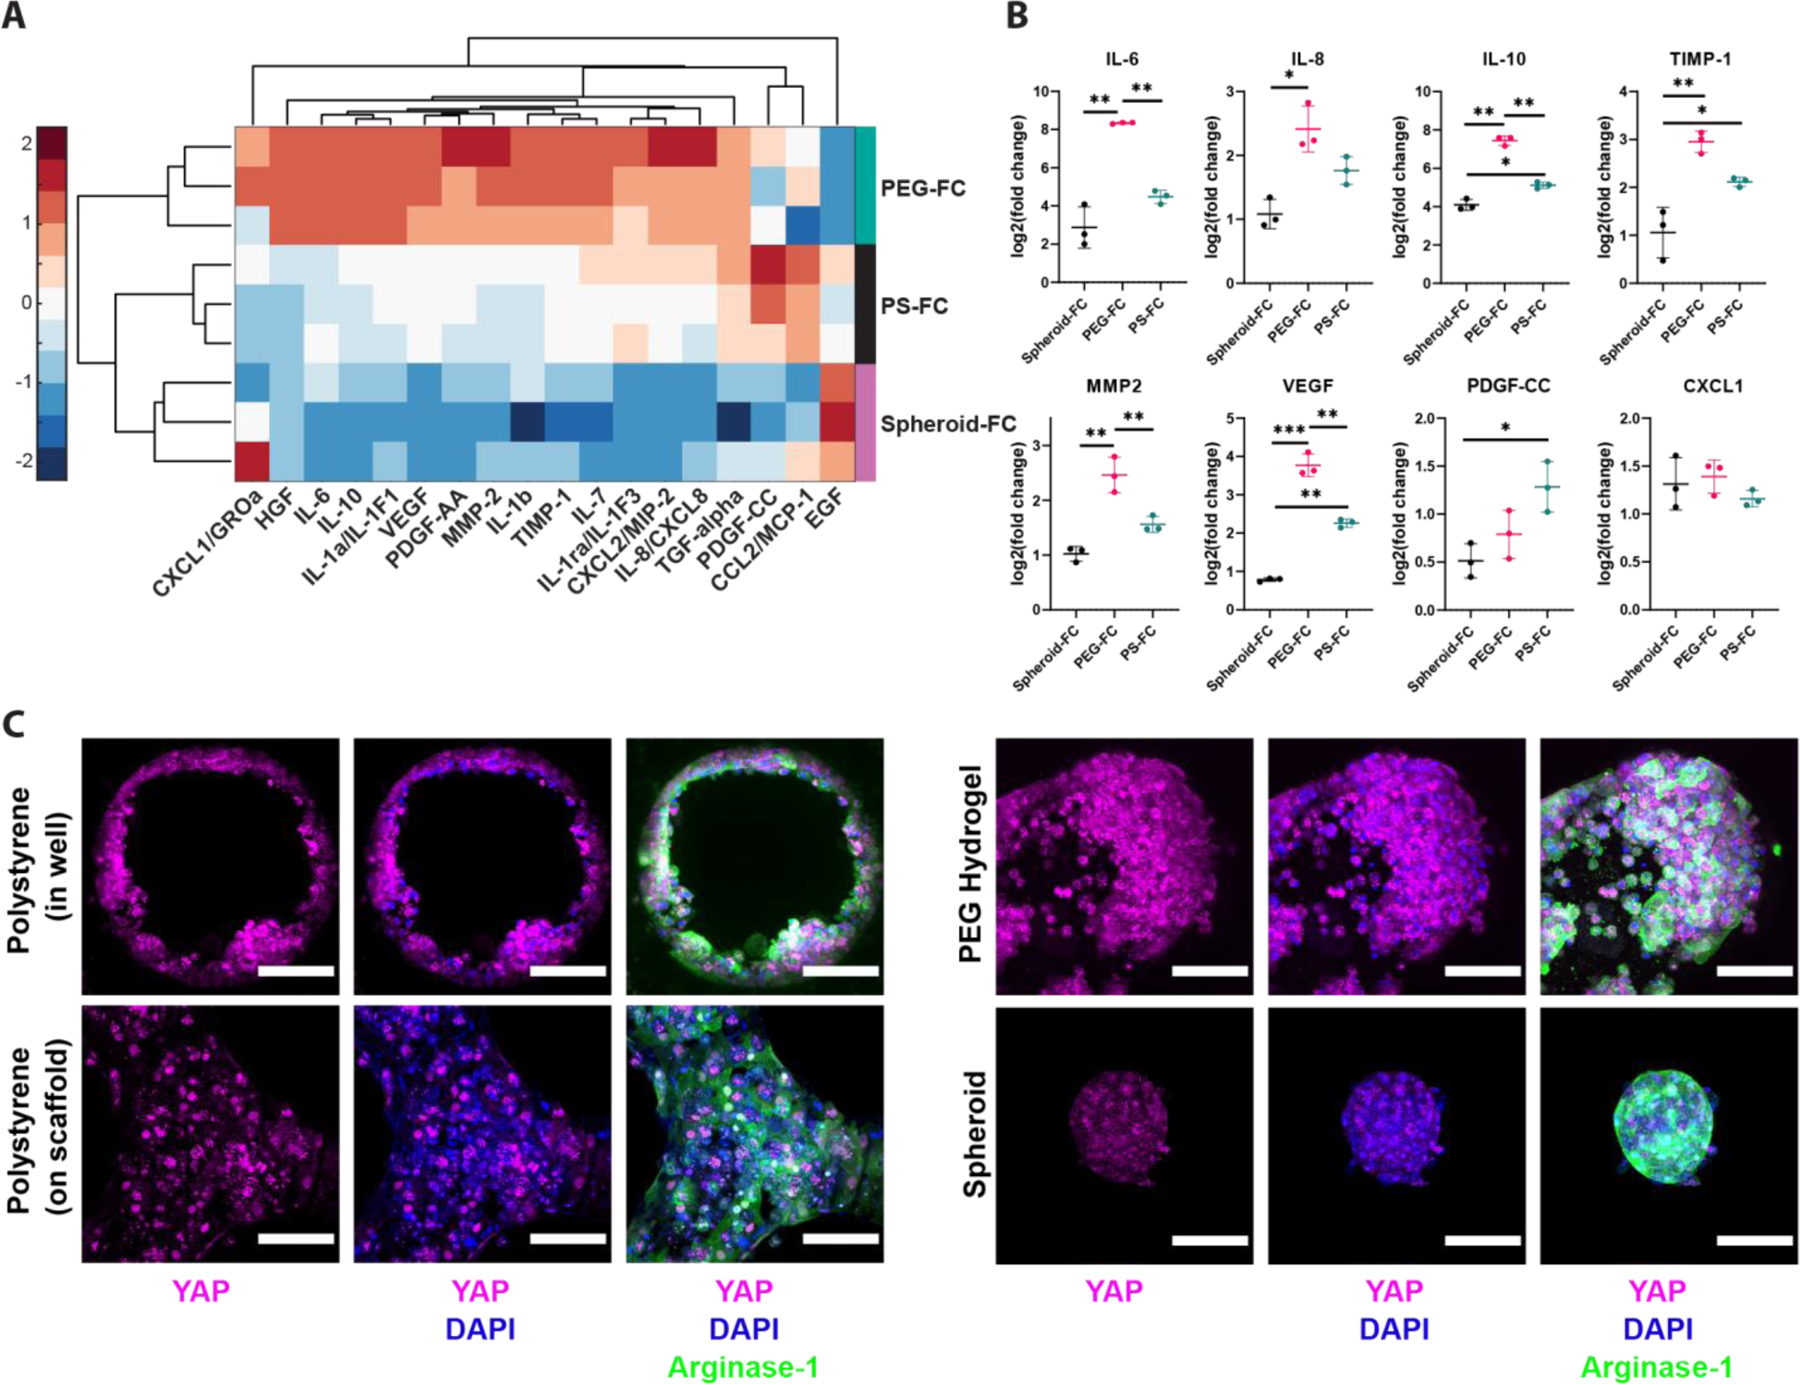
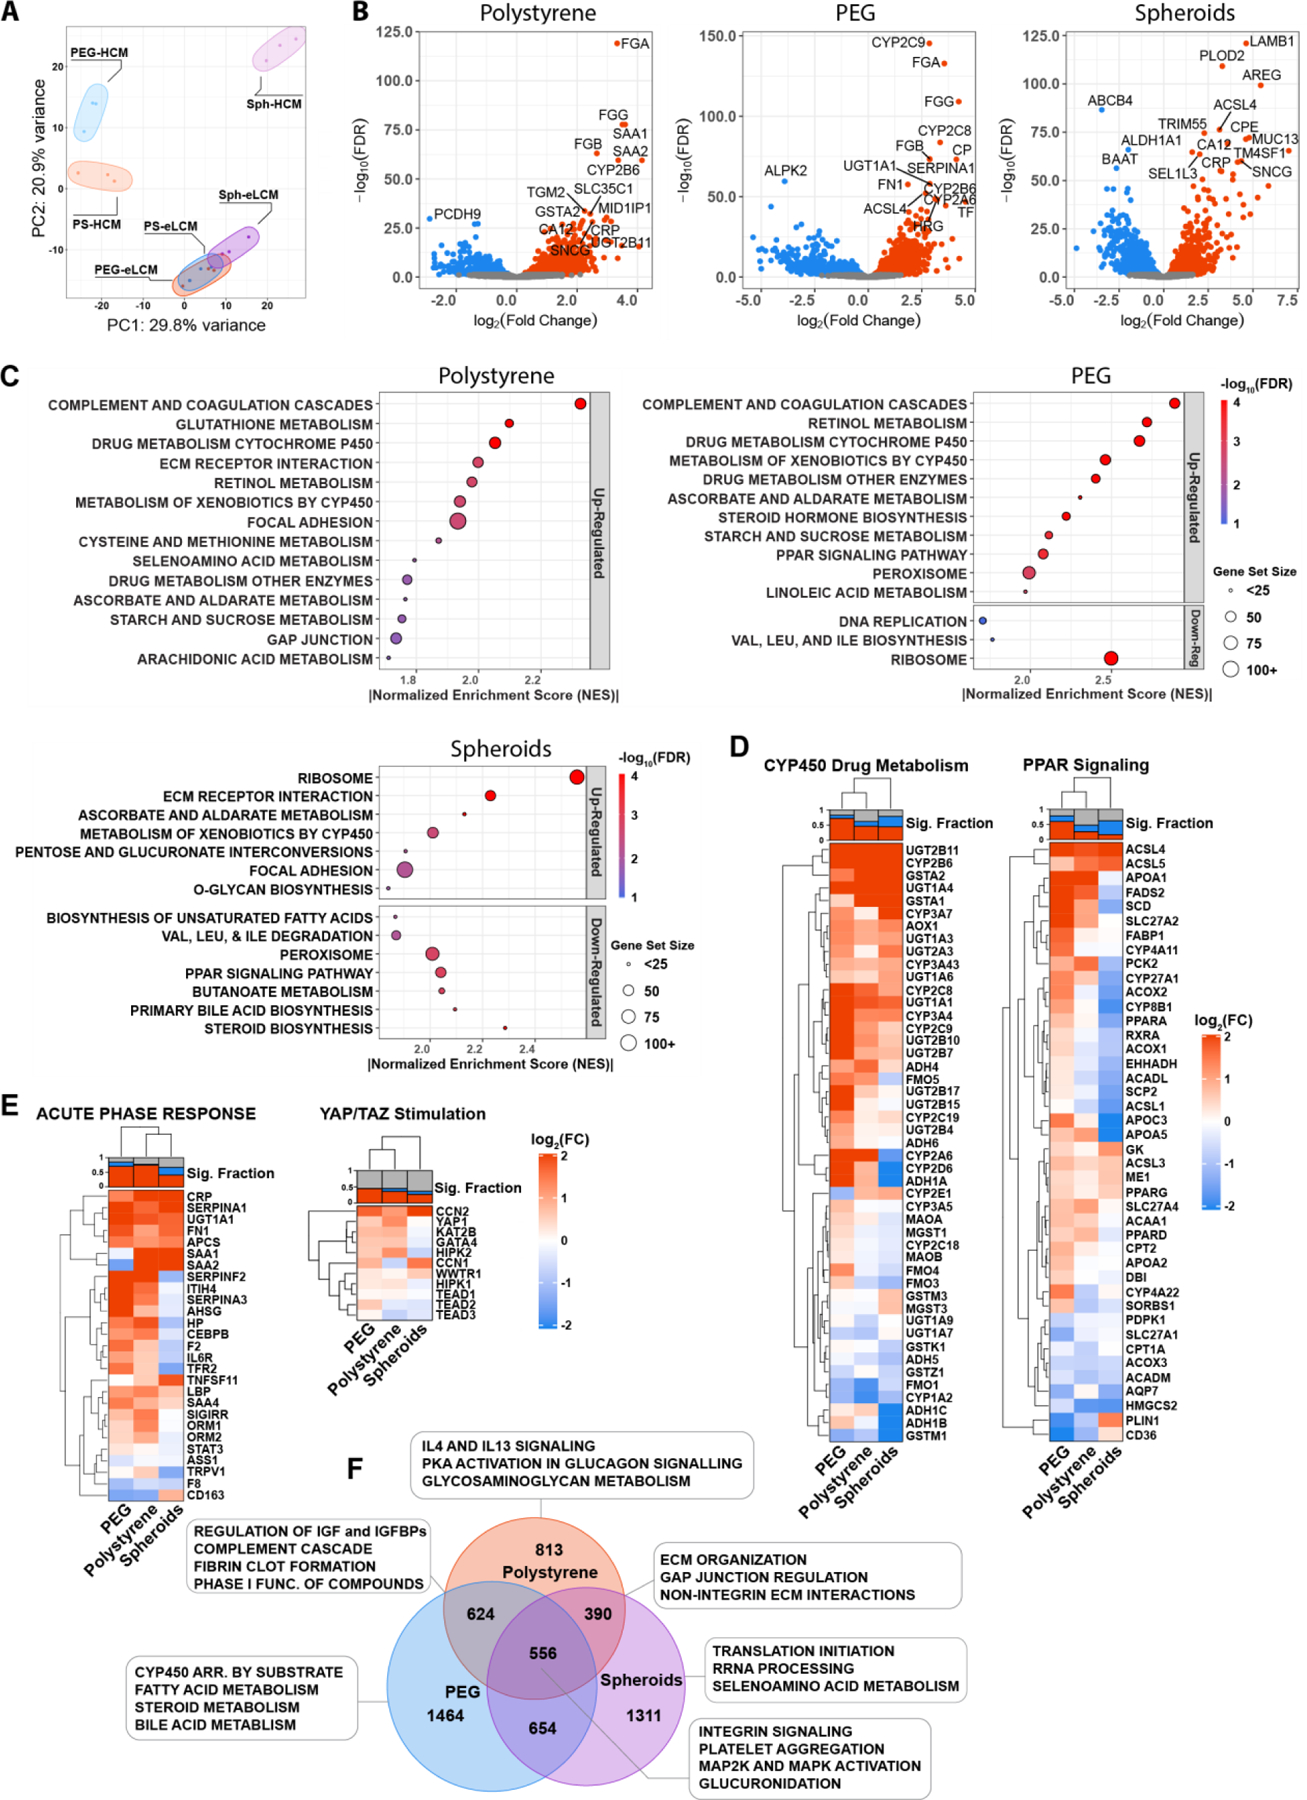
In vitro models of human liver functions are used across a diverse range of applications in preclinical drug development and disease modeling, with particular increasing interest in models that capture facets of liver inflammatory status. This study investigates how the interplay between biophysical and biochemical microenvironment cues influence phenotypic responses, including inflammation signatures, of primary human hepatocytes (PHH) cultured in a commercially available perfused bioreactor. A 3D printing-based alginate microwell system was designed to form thousands of hepatic spheroids in a scalable manner as a comparator 3D culture modality to the bioreactor. Soft, synthetic extracellular matrix (ECM) hydrogel scaffolds with biophysical properties mimicking features of liver were engineered to replace polystyrene scaffolds, and the biochemical microenvironment was modulated with a defined set of growth factors and signaling modulators. The supplemented media significantly increased tissue density, albumin secretion, and CYP3A4 activity but also upregulated inflammatory markers. Basal inflammatory markers were lower for cells maintained in ECM hydrogel scaffolds or spheroid formats than polystyrene scaffolds, while hydrogel scaffolds exhibited the most sensitive response to inflammation as assessed by multiplexed cytokine and RNA-seq analyses. Together, these engineered 3D liver microenvironments provide insights for probing human liver functions and inflammatory response in vitro.
Keywords: Liver; biomaterials; cell-matrix interactions; hepatocytes; hydrogel; spheroids; tissue engineering.
Conflict of interest statement
Conflicts of Interest The authors declare no conflicts of interest.
Figures
Similar articles
-
Efficient fabrication of monodisperse hepatocyte spheroids and encapsulation in hybrid hydrogel with controllable extracellular matrix effect.Biofabrication. 2021 Oct 18;14(1). doi: 10.1088/1758-5090/ac2b89. Biofabrication. 2021. PMID: 34587587
-
Liver extracellular matrix providing dual functions of two-dimensional substrate coating and three-dimensional injectable hydrogel platform for liver tissue engineering.Biomacromolecules. 2014 Jan 13;15(1):206-18. doi: 10.1021/bm4015039. Epub 2013 Dec 23. Biomacromolecules. 2014. PMID: 24350561
-
Functional Maturation of Induced Pluripotent Stem Cell Hepatocytes in Extracellular Matrix-A Comparative Analysis of Bioartificial Liver Microenvironments.Stem Cells Transl Med. 2016 Sep;5(9):1257-67. doi: 10.5966/sctm.2015-0235. Epub 2016 Jul 15. Stem Cells Transl Med. 2016. PMID: 27421950 Free PMC article.
-
Engineered biomaterials to guide spheroid formation, function, and fabrication into 3D tissue constructs.Acta Biomater. 2023 Jul 15;165:4-18. doi: 10.1016/j.actbio.2022.09.052. Epub 2022 Sep 24. Acta Biomater. 2023. PMID: 36167240 Free PMC article. Review.
-
Hydrogel microenvironments for cancer spheroid growth and drug screening.Sci Adv. 2018 Apr 27;4(4):eaas8998. doi: 10.1126/sciadv.aas8998. eCollection 2018 Apr. Sci Adv. 2018. PMID: 29719868 Free PMC article. Review.
Cited by
-
Modeling Tumor Cell Dormancy in an Ex Vivo Liver Metastatic Niche.Methods Mol Biol. 2024;2811:37-53. doi: 10.1007/978-1-0716-3882-8_3. Methods Mol Biol. 2024. PMID: 39037648
-
Polymer design of microwell hydrogels influences epithelial-mesenchymal interactions during human bronchosphere formation.Adv Nanobiomed Res. 2025 Jan;5(1):2300110. doi: 10.1002/anbr.202300110. Epub 2024 Nov 21. Adv Nanobiomed Res. 2025. PMID: 40740547
-
Liver-on-a-chip: Considerations, advances, and beyond.Biomicrofluidics. 2022 Nov 8;16(6):061502. doi: 10.1063/5.0106855. eCollection 2022 Dec. Biomicrofluidics. 2022. PMID: 36389273 Free PMC article. Review.
-
Influence of Structure-Property Relationships of Polymeric Biomaterials for Engineering Multicellular Spheroids.Bioengineering (Basel). 2025 Aug 9;12(8):857. doi: 10.3390/bioengineering12080857. Bioengineering (Basel). 2025. PMID: 40868370 Free PMC article. Review.
References
-
- Arias IM, Alter HJ, Boyer JL, Cohen DE, Shafritz DA, Thorgeirsson SS, Wolkoff AW, Eds., The Liver: Biology and Pathobiology, 6th ed., Wiley, 2020.
-
- Godoy P, Hewitt NJ, Albrecht U, Andersen ME, Ansari N, Bhattacharya S, Bode JG, Bolleyn J, Borner C, Böttger J, Braeuning A, Budinsky R. a., Burkhardt B, Cameron NR, Camussi G, Cho CS, Choi YJ, Craig Rowlands J, Dahmen U, Damm G, Dirsch O, Donato MT, Dong J, Dooley S, Drasdo D, Eakins R, Ferreira KS, Fonsato V, Fraczek J, Gebhardt R, Gibson A, Glanemann M, Goldring CEP, Gómez-Lechón MJ, Groothuis GMM, Gustavsson L, Guyot C, Hallifax D, Hammad S, Hayward A, Häussinger D, Hellerbrand C, Hewitt P, Hoehme S, Holzhütter HG, Houston JB, Hrach J, Ito K, Jaeschke H, Keitel V, Kelm JM, Kevin Park B, Kordes C, Kullak-Ublick G. a., Lecluyse EL, Lu P, Luebke-Wheeler J, Lutz A, Maltman DJ, Matz-Soja M, McMullen P, Merfort I, Messner S, Meyer C, Mwinyi J, Naisbitt DJ, Nussler AK, Olinga P, Pampaloni F, Pi J, Pluta L, Przyborski S. a., Ramachandran A, Rogiers V, Rowe C, Schelcher C, Schmich K, Schwarz M, Singh B, Stelzer EHK, Stieger B, Stöber R, Sugiyama Y, Tetta C, Thasler WE, Vanhaecke T, Vinken M, Weiss TS, Widera A, Woods CG, Xu JJ, Yarborough KM, Hengstler JG, Arch. Toxicol 2013, 87, 1315. - PMC - PubMed
-
- Weaver RJ, Blomme EA, Chadwick AE, Copple IM, Gerets HHJJ, Goldring CE, Guillouzo A, Hewitt PG, Ingelman-Sundberg M, Jensen KG, Juhila S, Klingmüller U, Labbe G, Liguori MJ, Lovatt CA, Morgan P, Naisbitt DJ, Pieters RHHH, Snoeys J, van de Water B, Williams DP, Park BK, Nat. Rev. Drug Discov 2019, 1. - PubMed
Grants and funding
LinkOut - more resources
Full Text Sources