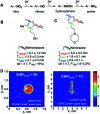
State-of-the-art accounts of hyperpolarized 15N-labeled molecular imaging probes for magnetic resonance spectroscopy and imaging
- PMID: 35872812
- PMCID: PMC9241963
- DOI: 10.1039/d2sc01264b
State-of-the-art accounts of hyperpolarized 15N-labeled molecular imaging probes for magnetic resonance spectroscopy and imaging
Abstract
Hyperpolarized isotope-labeled agents have significantly advanced nuclear magnetic resonance spectroscopy and imaging (MRS/MRI) of physicochemical activities at molecular levels. An emerging advance in this area is exciting developments of 15N-labeled hyperpolarized MR agents to enable acquisition of highly valuable information that was previously inaccessible and expand the applications of MRS/MRI beyond commonly studied 13C nuclei. This review will present recent developments of these hyperpolarized 15N-labeled molecular imaging probes, ranging from endogenous and drug molecules, and chemical sensors, to various 15N-tagged biomolecules. Through these examples, this review will provide insights into the target selection and probe design rationale and inherent challenges of HP imaging in hopes of facilitating future developments of 15N-based biomedical imaging agents and their applications.
This journal is © The Royal Society of Chemistry.
Conflict of interest statement
There are no conflicts to declare.
Figures


Similar articles
-
Design, synthesis and evaluation of 15N- and 13C-labeled molecular probes as hyperpolarized nitric oxide sensors.Bioorg Med Chem. 2022 Oct 15;72:116969. doi: 10.1016/j.bmc.2022.116969. Epub 2022 Aug 23. Bioorg Med Chem. 2022. PMID: 36029732 Free PMC article.
-
Hyperpolarized MRI - An Update and Future Perspectives.Semin Nucl Med. 2022 May;52(3):374-381. doi: 10.1053/j.semnuclmed.2021.09.001. Epub 2021 Nov 14. Semin Nucl Med. 2022. PMID: 34785033 Review.
-
Studies of Metabolism Using (13)C MRS of Hyperpolarized Probes.Methods Enzymol. 2015;561:1-71. doi: 10.1016/bs.mie.2015.04.001. Epub 2015 Jun 19. Methods Enzymol. 2015. PMID: 26358901 Review.
-
Hyperpolarized (13)C MR imaging detects no lactate production in mutant IDH1 gliomas: Implications for diagnosis and response monitoring.Neuroimage Clin. 2016 Jun 23;12:180-9. doi: 10.1016/j.nicl.2016.06.018. eCollection 2016. Neuroimage Clin. 2016. PMID: 27437179 Free PMC article.
-
The use of hyperpolarized carbon-13 magnetic resonance for molecular imaging.Adv Drug Deliv Rev. 2017 Apr;113:3-23. doi: 10.1016/j.addr.2016.08.011. Epub 2016 Sep 4. Adv Drug Deliv Rev. 2017. PMID: 27599979 Free PMC article. Review.
Cited by
-
Late-Stage Isotopic Exchange of Primary Amines.J Am Chem Soc. 2023 Nov 8;145(44):24367-24374. doi: 10.1021/jacs.3c09442. Epub 2023 Oct 27. J Am Chem Soc. 2023. PMID: 37889497 Free PMC article.
-
Decarboxylative stereoretentive C-N coupling by harnessing aminating reagent.Nat Commun. 2024 May 6;15(1):3788. doi: 10.1038/s41467-024-48075-w. Nat Commun. 2024. PMID: 38710673 Free PMC article.
-
In vivo molecular imaging of breast cancer metabolic heterogeneity using [1-13C]pyruvate-d3 hyperpolarized by reversible exchange with parahydrogen.Theranostics. 2025 Mar 3;15(9):3714-3723. doi: 10.7150/thno.103272. eCollection 2025. Theranostics. 2025. PMID: 40213665 Free PMC article.
-
15N SABRE-SHEATH and NMR/DFT Characterization of Amino-Metronidazole, a Metabolic Product of the Antibiotic and Prospective Hypoxia Contrast Agent Metronidazole.J Phys Chem B. 2025 Feb 6;129(5):1662-1669. doi: 10.1021/acs.jpcb.4c07877. Epub 2025 Jan 22. J Phys Chem B. 2025. PMID: 39843250
-
Post-functionalization of polyethers by photoinduced C-H amidation via polar-radical relay.Nat Commun. 2025 Aug 26;16(1):7965. doi: 10.1038/s41467-025-63254-z. Nat Commun. 2025. PMID: 40858601 Free PMC article.
References
-
- Hou B. L. and Hu J., in Tumor Biomarker Discovery: Methods and Protocols, ed. M. A. Tainsky, Humana Press, Totowa, NJ, 2009, pp. 297–314, DOI: 10.1007/978-1-60327-811-9_21 - DOI
Publication types
Grants and funding
LinkOut - more resources
Full Text Sources
Research Materials
Miscellaneous

