. 2022 Jul 14:2022:7742687.
doi: 10.1155/2022/7742687. eCollection 2022.

Effect of Different Membranes on Vertical Bone Regeneration: A Systematic Review and Network Meta-Analysis

Affiliations

Effect of Different Membranes on Vertical Bone Regeneration: A Systematic Review and Network Meta-Analysis

Mi Zhang et al. Biomed Res Int. .

Abstract

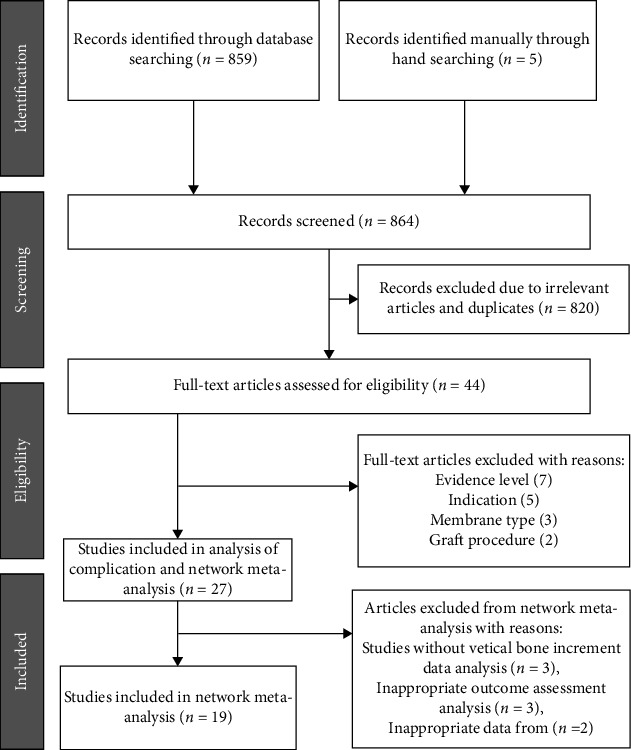
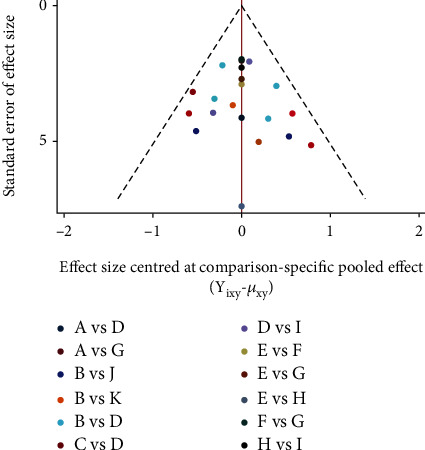
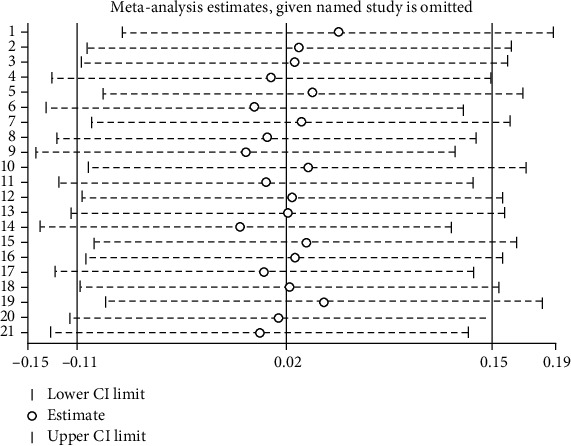
This study is aimed at performing a systematic review and a network meta-analysis of the effects of several membranes on vertical bone regeneration and clinical complications in guided bone regeneration (GBR) or guided tissue regeneration (GTR). We compared the effects of the following membranes: high-density polytetrafluoroethylene (d-PTFE), expanded polytetrafluoroethylene (e-PTFE), crosslinked collagen membrane (CCM), noncrosslinked collagen membrane (CM), titanium mesh (TM), titanium mesh plus noncrosslinked (TM + CM), titanium mesh plus crosslinked (TM + CCM), titanium-reinforced d-PTFE, titanium-reinforced e-PTFE, polylactic acid (PLA), polyethylene glycol (PEG), and polylactic acid 910 (PLA910). Using the PICOS principles to help determine inclusion criteria, articles are collected using PubMed, Web of Science, and other databases. Assess the risk of deviation and the quality of evidence using the Cochrane Evaluation Manual, and GRADE. 27 articles were finally included. 19 articles were included in a network meta-analysis with vertical bone increment as an outcome measure. The network meta-analysis includes network diagrams, paired-comparison forest diagrams, funnel diagrams, surface under the cumulative ranking curve (SUCRA) diagrams, and sensitivity analysis diagrams. SUCRA indicated that titanium-reinforced d-PTFE exhibited the highest vertical bone increment effect. Meanwhile, we analyzed the complications of 19 studies and found that soft tissue injury and membrane exposure were the most common complications.


Conflict of interest statement

The authors declare that they have no conflicts of interest.

Figures

Figure 1
Figure 1
Preferred reporting items for systematic reviews and meta-analysis (PRISMA) flowchart of the search strategy for the systematic review.
Figure 2
Figure 2
A network geometry plot. The plot presents the result of a network meta-analysis of the direct comparison of the 11 interventions. The width of the lines is proportional to the number of direct lines comparing every pair of interventions, and the size of every blue dot is proportional to the sample size of the interventions.
Figure 3
Figure 3
Funnel plot of publication bias. The horizontal axis represents the difference between the study-specific effect sizes from the corresponding comparison-specific summary effect. The vertical axis represents the standard error of the effect size. The red line represents the null hypothesis, in which the study-specific effect sizes do not differ from the respective comparison-specific pooled effect estimates.
Figure 4
Figure 4
A forest map of pairwise comparison. A forest plot of pairwise comparison. The black horizontal lines represent the confidence interval (CI) of each study. The black solid diamonds represent the standard mean difference (SMD) for each study. The blue hollow diamond represents the result of pairwise comparison or the result of the entire study. The gray squares represent the weight of individual studies; therefore, the larger the sample size, the larger the weight and the larger the square area. The black vertical line in the middle is an invalid line.
Figure 5
Figure 5
Plots of the SUCRA for all treatments included in this study. The SUCRA for all interventions that were included. The plot shows the percentage and ranking of the effectiveness of each treatment.
Figure 6
Figure 6
Risk of bias graph.
Figure 7
Figure 7
Risk of bias summary.
Figure 8
Figure 8
Influence of individual studies on overall results.
Figure 9
Figure 9
Results of the complication analysis. (red: number of control group occurrences > number of experimental group occurrences; green: number of experimental group occurrences > number of control group occurrences; yellow: there is no significant difference between the two groups).

References

    1. Rakhmatia Y. D., Ayukawa Y., Furuhashi A., Koyano K. Current barrier membranes: titanium mesh and other membranes for guided bone regeneration in dental applications. Journal of Prosthodontic Research . 2013;57(1):3–14. doi: 10.1016/j.jpor.2012.12.001. - DOI - PubMed
    1. Buser D., Dahlin C., Schenk R. Guided bone regeneration . Chicago Quintessence; 1994.
    1. Elgali I., Omar O., Dahlin C., Thomsen P. Guided bone regeneration: materials and biological mechanisms revisited. European Journal of Oral Sciences . 2017;125(5):315–337. doi: 10.1111/eos.12364. - DOI - PMC - PubMed
    1. Bottino M. C., Thomas V., Schmidt G., et al. Recent advances in the development of GTR/GBR membranes for periodontal regeneration--a materials perspective. Dental Materials . 2012;28(7):703–721. doi: 10.1016/j.dental.2012.04.022. - DOI - PubMed
    1. Wang J., Wang L., Zhou Z., et al. Biodegradable polymer membranes applied in guided bone/tissue regeneration: a review. Polymers . 2016;8(4):p. 8. doi: 10.3390/polym8040115. - DOI - PMC - PubMed

Publication types

LinkOut - more resources