. 2022 Jul 8:10:922094.
doi: 10.3389/fchem.2022.922094. eCollection 2022.

Fluorescence Imaging of Extracellular Potassium Ion Using Potassium Sensing Oligonucleotide

Affiliations

Fluorescence Imaging of Extracellular Potassium Ion Using Potassium Sensing Oligonucleotide

Shinobu Sato et al. Front Chem. .

Abstract

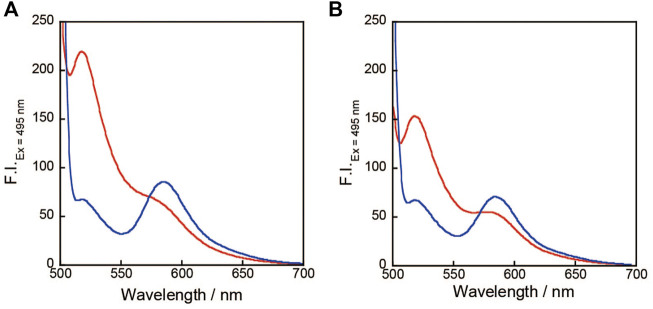
Potassium-sensing oligonucleotide, PSO, a conjugate of a quadruplex structure-forming oligonucleotide with a peptide incorporating a Förster Resonance Energy Transfer (FRET) chromophore pair, has been developed for fluorescent detection of potassium ion (K+) in aqueous medium. PSO 1 could be introduced into cells for real-time imaging of cytoplasmic K+ concentrations. To perform fluorescent imaging of K+ on the cell surface, we synthesized twelve PSO derivatives with different types of peptide types and lengths, and oligonucleotide sequences including thrombin-binding aptamer (TBA) sequences with FAM and TAMRA as a FRET chromophore pair, and evaluated their performance. 1 was shown to respond selectively to K+, not to most ions present in vivo, and to show reciprocal fluorescence changes in response to K+ concentration. For the peptide chains and oligonucleotide sequences examined in this study, the PSO derivatives had K d values for K+ in the range of 5-30 mM. All PSO derivatives showed high K+ selectivity even in the presence of excess Na+. The PSO derivatives were successfully localized to the cell surface by biotinylated concanavalin A (ConA) or sulfo-NHS-biotin via streptavidin (StAv). Fluorescence imaging of extracellular K+ upon addition of apoptosis inducers was successfully achieved by 1 localized to the cell surface.

Keywords: G-quadruplex; cell surface; fluorometric imaging; potassium ion; potassium ion efflux; potassium sensing oligonucleotide; sodium ion.


Conflict of interest statement

The authors declare that the research was conducted in the absence of any commercial or financial relationships that could be construed as a potential conflict of interest.

Figures

FIGURE 1
FIGURE 1
(A) Example of potassium-sensing oligonucleotide (PSO) 1 consisting of oligonucleotide-carrying TBA sequence, peptide linker with biotin, and FRET chromophore pair of FAM and TAMRA. (B) PSO localized on a cell surface through sugar chain, concanavalin A (ConA), and avidin (left) or biotinylated membrane protein, avidin (right). Black circle: biotin; red circle: FRET chromophore pair.
FIGURE 2
FIGURE 2
(A) Fluorescence spectra of 0.2 μM 1, 0.3 μM StAv in the absence (red) or presence (blue) of 150 mM KCl, 20 mM Tris-HCl (pH 7.4) without (A) or with 145 mM NaCl (B).
FIGURE 3
FIGURE 3
ΔRatio of 0.2 μM 1 in the absence (−) or presence (+) of 0.3 μM streptavidin (StAv) in 20 mM Tris-HCl (pH 7.4) under several cations; 150 mM KCl, 145 mM NaCl, 2 mM MgCl2, 2 mM CaCl2, 20 mM CH3COONH4, or 150 mM LiCl. Ex: 495 nm.
FIGURE 4
FIGURE 4
(A) Extracell imaging by 1-StAv-ConA, (B) fluorescence ratio of Fred/Fgreen (Fred: F.I. of 550–640 nm,/Fgreen: F.I. of 495–540 nm) after adding KCl, λ ex = 488 nm. (C) Extracell imaging by 1-StAv-sulfo-NHS-biotin, (D) fluorescence ratio of Fred/Fgreen after adding KCl, λ ex = 488 nm. (↑) indicates the change of DMEM medium.
FIGURE 5
FIGURE 5
(A) Cell surface imaging by 1-StAv-ConA after adding 10 μM Amphotericin B, 10 μM Bumetanide, and 10 μM Ouabain/DMEM at 11 min (↑), (B) fluorescence ratio of Fred/Fgreen (Fred: F.I. of 575–595 nm,/Fgreen: F.I. of 508–528 nm), λ ex = 488 nm in all cells. (C) Extracell imaging by 1-StAv-sulfo-NHS-biotin and (D) fluorescence ratio of Fred/Fgreen (Fred: F.I. of 554–620 nm, Fgreen: F.I. of 500–554 nm), λ ex = 488 nm after adding 26 μM Amphotericin B at 11 min (↑). The three cells shown in (C) were surrounded by ROI (region of interests), and their fluorescence ratios were shown in (D).

References

    1. Bischof H., Rehberg M., Stryeck S., Artinger K., Eroglu E., Waldeck-Weiermair M., et al. (2017). Novel Genetically Encoded Fluorescent Probes Enable Real-Time Detection of Potassium In Vitro and In Vivo . Nat. Commun. 8, 1422. 10.1038/s41467-017-01615-z - DOI - PMC - PubMed
    1. Chen H., MeisburgerMeisburger S. P. S. P., Pabit S. A., Sutton J. L., Webb W. W., Pollack L. (2012). Ionic Strength-dependent Persistence Lengths of Single-Stranded RNA and DNA. Proc. Natl. Acad. Sci. U.S.A. 109, 799–804. 10.1073/pnas.1119057109 - DOI - PMC - PubMed
    1. Dai J., Carver M., Yang D. (2008). Polymorphism of Human Telomeric Quadruplex Structures. Biochimie 90, 1172–1183. 10.1016/j.biochi.2008.02.026 - DOI - PMC - PubMed
    1. Dembska A., Świtalska A., Fedoruk-Wyszomirska A., Juskowiak B. (2020). Development of Fluorescence Oligonucleotide Probes Based on Cytosine- and Guanine-Rich Sequences. Sci. Rep. 10, 11006. 10.1038/s41598-020-67745-5 - DOI - PMC - PubMed
    1. Fogh-Andersen N., Wimberley P. D., Thode J., Siggaard-Andersen O. (1984). Determination of Sodium and Potassium with Ion-Selective Electrodes. Clin. Chem. 30, 433–436. 10.1093/clinchem/30.3.433 - DOI - PubMed

LinkOut - more resources