. 2022 Jul 7:12:904775.
doi: 10.3389/fcimb.2022.904775. eCollection 2022.

MicroRNA let-7 Suppresses Influenza A Virus Infection by Targeting RPS16 and Enhancing Type I Interferon Response

Affiliations

MicroRNA let-7 Suppresses Influenza A Virus Infection by Targeting RPS16 and Enhancing Type I Interferon Response

Wenjiao Wu et al. Front Cell Infect Microbiol. .

Abstract

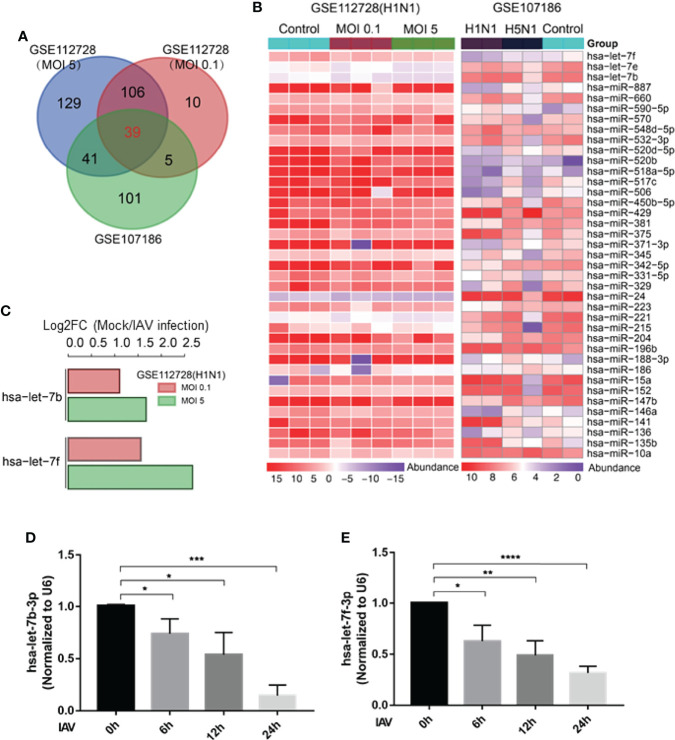
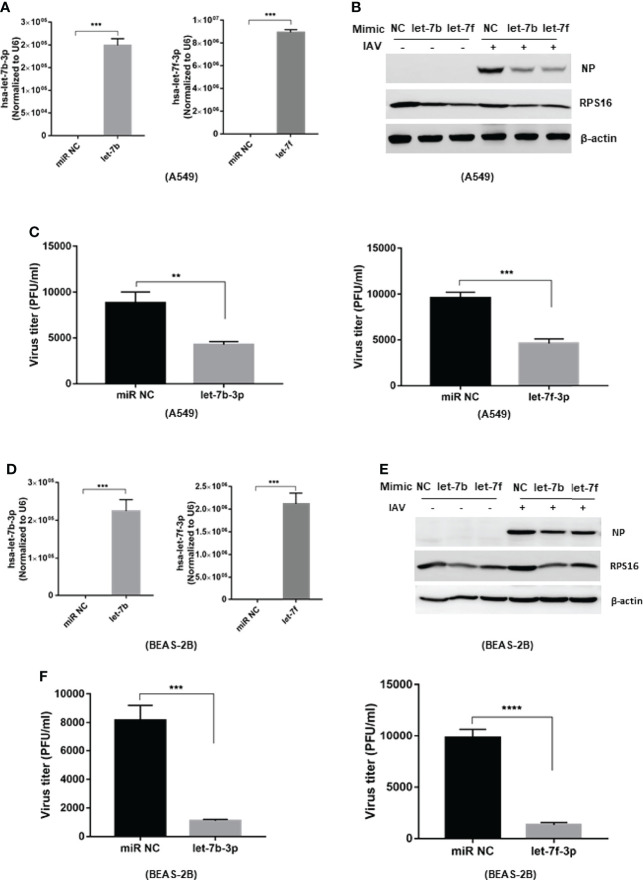
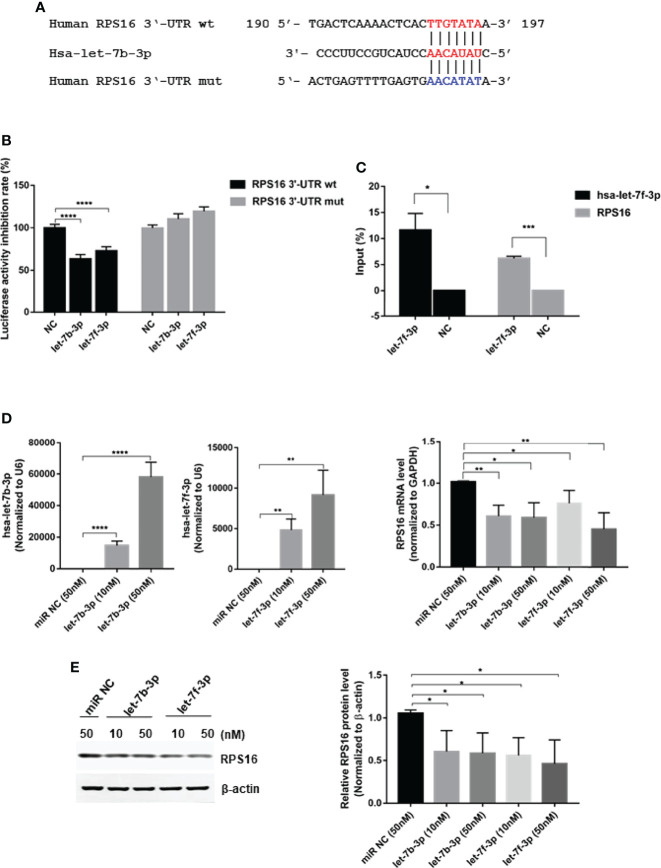
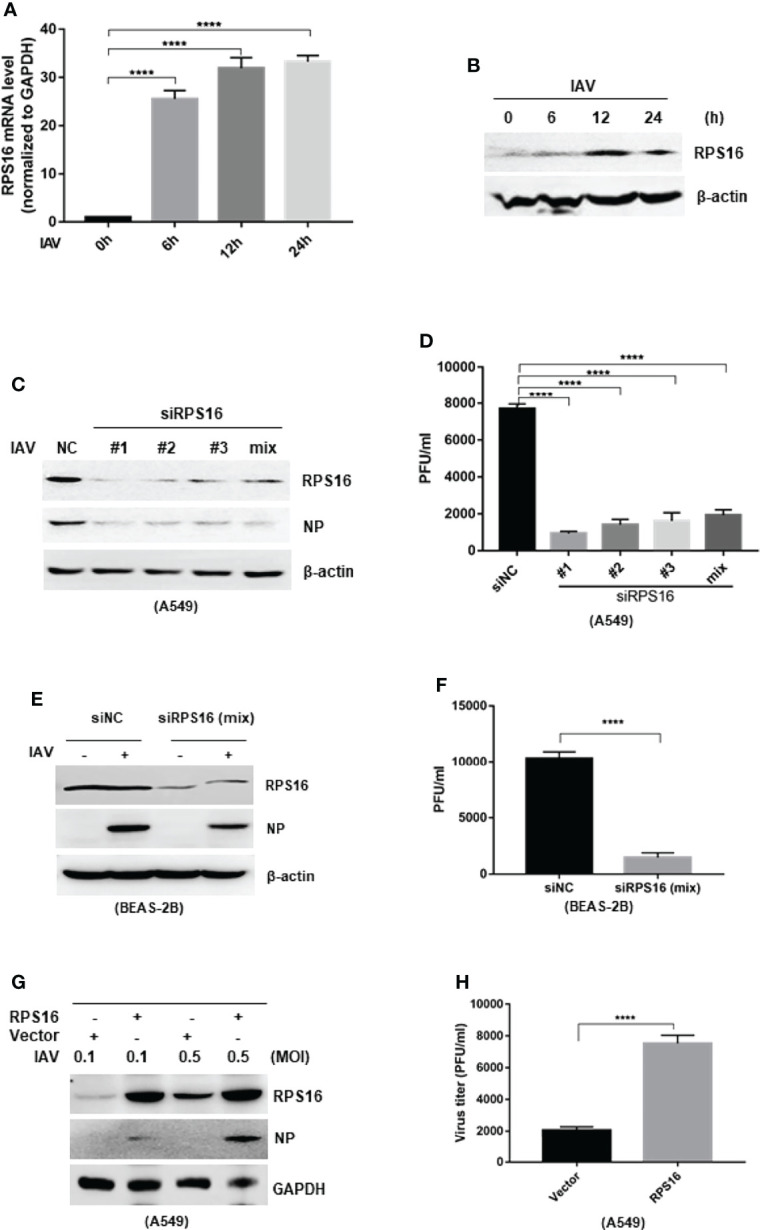
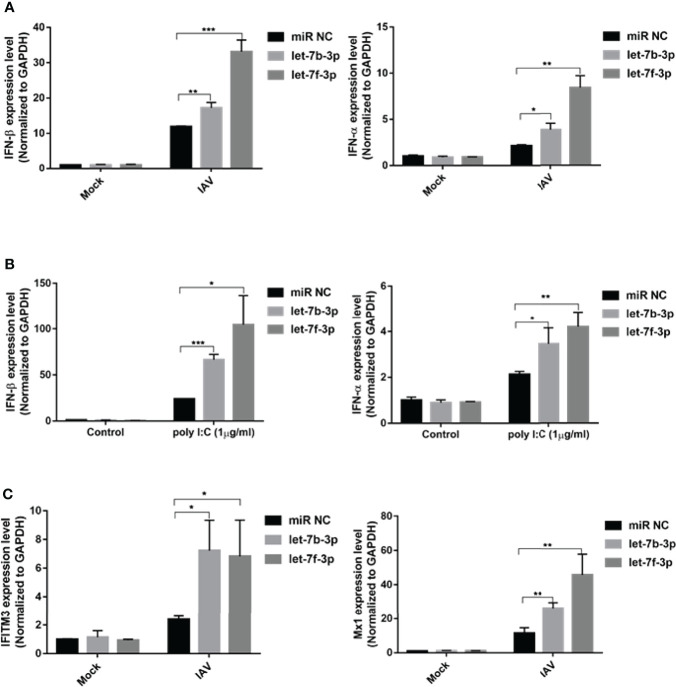
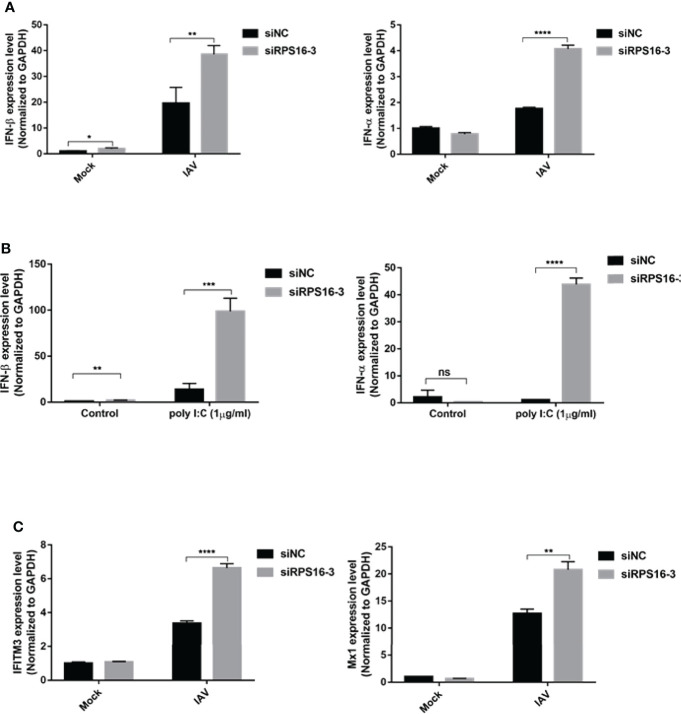
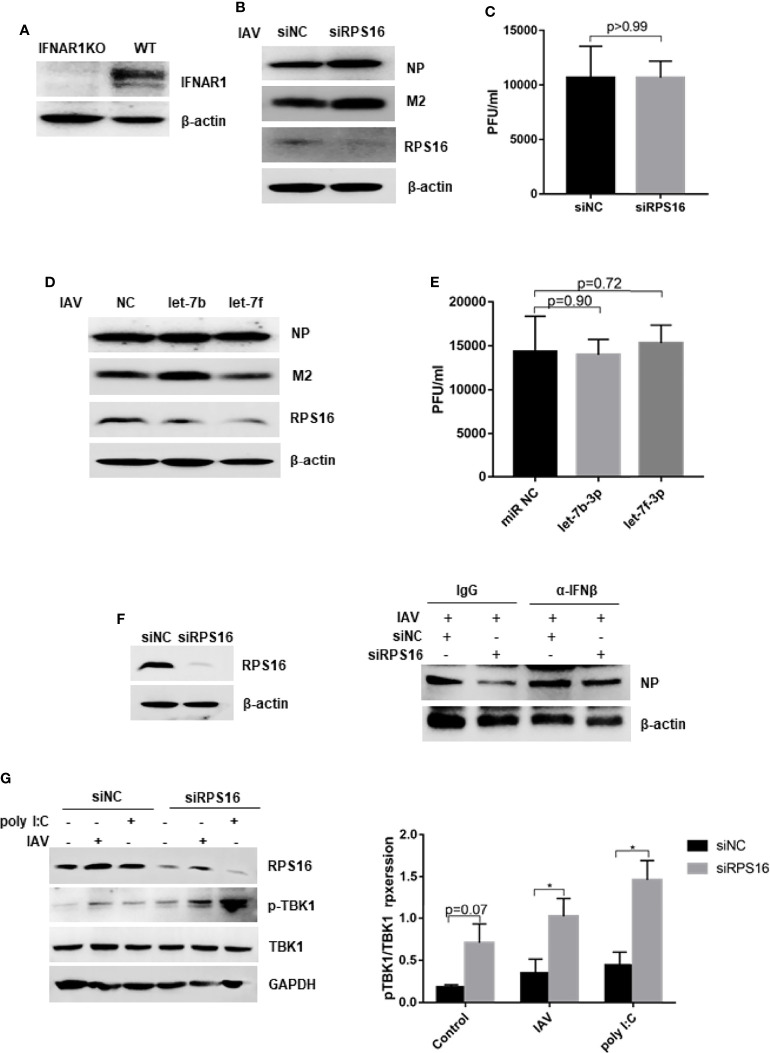
Given the frequent emergence of drug-resistant influenza virus strains and new highly pathogenic influenza virus strains, there is an urgent need to identify new antiviral drugs and targets. We found that influenza A virus (IAV) infection caused a significant decrease of microRNA let-7 expression in host cells; that overexpression of let-7 increased interferon expression and effectively inhibit IAV infection; and that let-7 targets the 3'-untranslated region (UTR) of the ribosomal protein 16 (RPS16) gene, decreasing its expression. Knocking down the expression of RPS16 increased the expression of type I interferon and inhibited viral replication. The present study uncovered the regulatory effect of let-7b and let-7f on influenza A infection, which is a potential biomarker of IAV infection. In addition, let-7 may be a promising therapeutic agent against influenza A.

Keywords: antivirals; influenza A virus; microRNA let-7; rps16; type I interferon.


Conflict of interest statement

The authors declare that the research was conducted in the absence of any commercial or financial relationships that could be construed as potential conflicts of interest.

Figures

Figure 1
Figure 1
Let-7 expression decreases after IAV infection. (A) Venn diagram of differentially expressed miRNAs during IAV infection. (B) Heat map representing the 39 downregulated miRNAs from the two microarray dataset GSE112728 and GSE107186. (C) Analysis of hsa-let-7b and hsa-let-7f down-regulation of in GSE112728 microarray that the cell infected with 0.1 and 5 MOI of IAV compared with Mock cell. (D, E) A549 cell was infected with influenza A/WSN/1933 virus (MOI = 1) for 0, 6, 12 and 24h, the expression of hsa-let-7b-3p and hsa-let-7f-3p was accessed by real-time qPCR and normalized to expression of U6. Data are the mean ± SD from three independent experiments, *p < 0.05, **p < 0.01 vs. 0h control cell by t-test.
Figure 2
Figure 2
Over-expression of let-7b and let-7 inhibits influenza A virus infection to the host cell. The mimic of hsa-let-7b-3p and hsa-7f-3p (50nM) were transfected to A549 cell, the expression of let-7b-3p and let-7f-3p was detected by RT-PCR (A). At 48h post transfection, the cells were infected with influenza A/WSN/1933 virus at 0.1 of MOI; (B) the influenza NP protein expression were measured by western blotting at 24h post infection; (C) the new born virus titer in the supernatants was tested by plaque forming assay and calculated. (D) The expression of let-7b-3p and let-7f-3p in BEAS-2B cell transfected with the mimic of hsa-let-7b-3p, hsa-7f-3p (50nM) for 48h. At 48h post transfection, the cells were infected with influenza A/WSN/1933 virus at 0.1 of MOI; (E) the influenza NP protein expression were measured by western blotting at 24h post infection; (F) the new born virus titer in the supernatants was tested by plaque forming assay and calculated. Data were shown as mean ± SD (**p < 0.01, ***p < 0.001).
Figure 3
Figure 3
RPS16 is a direct target of let-7. (A) Schematic representation of predicted target sites of hsa-let-7b-3p in the 3’-UTR of RPS16 and mutant RPS16 3’-UTR reporter constructs. (B) 293T cells were co-transfected with RPS16-3’-UTR luciferase reporter plasmid, RPS16-3’-UTR mut luciferase reporter plasmid (100ng/well), together with negative mimic (miR NC) or let-7b-3p/let-7f-3p mimic (50 nM). After 48 h, firefly luciferase activity was measured and normalized to Renilla luciferase activity. Data are the mean ± SD from four independent experiments. (****P < 0.0001 vs. negative mimic by t-test. (C) RNA pulldown assay indicated that biotin−hsa-let-7b-3p precipitated with RPS16 mRNA, Lac Z(NC)served as a negative control, the precipitated mRNA was reverse transcripted into cDNA and detected by RT-PCR, the relative expression level was compared to the gene expression in the input RNA. Data were shown as mean ± SD, *p < 0.05, ***p < 0.001. (D) A549 cells were transfected with let-7b-3p/let-7f-3p mimic or negative mimic (miR NC) at a final concentration of 10 nM and 50 nM, respectively. After 24 h, the expression of RPS16 was measured by real-time qPCR and normalized to expression of GAPDH. Data are the mean ± SD from three independent experiments. *p < 0.05, **p < 0.01 vs. negative control by t-test. (E) A549 cells were transfected with let-7b-3p/let-7f-3p mimic or negative mimic (miR NC) at a final concentration of 10 and 50 nM, respectively. After 48 h, RPS16 protein expression was analyzed by Western blot and the gray scale quantitation of the bands were analyzed by Image J software and normalized to the loading control. β-actin was used as loading control. Data are representative of three independent experiments, *p < 0.05.
Figure 4
Figure 4
RPS16 promotes IAV replication. A549 cell was infection with influenza A/wsn/1933 virus (MOI=1) for 0, 6, 12 and 24h; (A) the expression of RPS16 mRNA was detected by real-time qPCR and normalized to expression of GAPDH. Data are the mean ± SD from three independent experiments, ****P < 0.0001 vs. 0h control cell by t-test; (B) the expression of RPS16 protein after IAV infection was detected by western blot. Data are representative of at least three independent experiments. (C and D) A549 cells were transfected with siNC or siRPS16. After 48 h, the cells were infected with influenza A/wsn/1933 virus of 0.1MOI, the expression of influenza NP protein was detected by westen blot (C); (D) The virus titer in the supernatants was infected to MDCK cell and measured the viral titer by plaque forming assay, data were shown as mean ± SD (**p < 0.01, ***p < 0.001). (E and F) BEAS-2B cells were transfected with siNC or siRPS16. After 48 h, the cells were infected with influenza A/wsn/1933 virus (MOI = 0.1), the expression of influenza NP protein was detected by westen blot (E). The virus in the supernatants was infected to MDCK cell and measured the viral titer by plaque forming assay (F), data were shown as mean ± SD (**p < 0.01, ***p < 0.001). (G, H) A549 cells were transfected with RPS16 expressing vector or control vector. After 48 h, the transfected cells were infected with influenza A/wsn/1933 virus of 0.1 MOI and 0.5 MOI, the expression of influenza NP protein was detected by westen blot (E); the virus in the supernatants infected with 0.1 MOI was measured the viral titer by plaque forming assay (F). Data were shown as mean ± SD (**p < 0.01, ***p < 0.001). Data are the representative of three independent experiments.
Figure 5
Figure 5
Let-7 upregulates IAV-triggered type I IFN induction. A549 cell was transfected with the mimics of hsa-let-7b-3p, hsa-7f-3p or negative control (miR NC). (A) At 48h post transfection, the cells were infected with influenza A/WSN/1933 virus (MOI=1) for 12h, the expression of IFN-β and IFN-α were detected by real-time qPCR and normalized to expression of GAPDH; (B) At 48h post transfection, the cells were transfected with poly I:C (1µg/ml) for 12h, the expression of IFN-β and IFN-α were detected by real-time qPCR and normalized to expression of GAPDH. (C) At 48h post transfection, the cells were infected with influenza A/WSN/1933 virus at 1 of MOI for 12h, the expression of IFITM3 and Mx1 were detected by real-time qPCR and normalized to expression of GAPDH. Data were shown as mean ± SD (*p < 0.05, **p < 0.01, ***p < 0.001). Data are the representative of three independent experiments.
Figure 6
Figure 6
RPS16 is a type I IFN repressor during virus infection. A549 cell was transfected with siRNA specific to RPS16 (siRPS16) or negative control (siNC). (A) At 48h post transfection, the cells were infected with influenza A/WSN/1933 virus at 1 of MOI for 12h, the expression of IFN-β and IFN-α were detected by real-time qPCR and normalized to expression of GAPDH; (B) At 48h post transfection, the cells were transfected with poly I:C (1µg/ml) for 12h, the expression of IFN-β and IFN-α were detected by real-time qPCR and normalized to expression of GAPDH. (C) At 48h post transfection, the cells were infected with influenza A/WSN/1933 virus at 1 of MOI for 12h, the expression of IFITM3 and Mx1 were detected by real-time qPCR and normalized to expression of GAPDH. Data were shown as mean ± SD (*p < 0.05, **p < 0.01, ***p < 0.001). Data are the representative of three independent experiments.
Figure 7
Figure 7
Dampening type I IFN signaling impairs inhibition of IAV replication by let-7 and siRPS16. (A) The expression of IFNAR1 was tested by western blot in IFNAR knock out (KO) and wild type A549 cell. The IFNAR1-/- A549 cell was transfected with 50nM mimics of hsa-let-7b-3p, hsa-7f-3p or negative control (miR NC); (B) at 48 h post transfection, the cells were infected with influenza A/WSN/1933 virus (MOI = 0.1), the expression of influenza NP and M2 protein were detected by western blot; (C) the new born virus titer in the supernatants was tested by plaque forming assay. IFNAR1-/- A549 cell was transfected with siRPS16 or siNC (50nM); at 48h post transfection, the cells were infected with influenza A/WSN/1933 virus (MOI = 0.1), (D) the expression of influenza NP and M2 protein were detected by western blot; (E) the new born virus titer in the supernatants was tested by plaque forming assay; (F) wild-type A549 cell was transfected with siRPS16 (or siNC control), the transfected cell was infected with influenza A/WSN/1933 virus (MOI = 0.1) at 48h post transfection; the cell was maintained with the medium including IFN-β or isotype control IgG. Viral NP expression was detected by western blot at 24 post infection. (G) Wild-type A549 cell was transfected with siRPS16 or siNC. At 48h post infection, the cell was infected with 3 MOI of influenza A/WSN/1933 virus or transfected with 1µg/ml poly I:C for 12h, the expression of TBK1 was detected by western blot. The gray scale of pTBK1 was analyzed by Image J normalized to the gray scale intensity of TBK1. Data are the representative of three independent experiments.

Similar articles

Cited by

References

    1. Ambros V. (2001). microRNAs: Tiny Regulators With Great Potential. Cell 107, 823–826. doi: 10.1016/S0092-8674(01)00616-X - DOI - PubMed
    1. Ambros V. (2004). The Functions of Animal microRNAs. Nature 431, 350–355. doi: 10.1038/nature02871 - DOI - PubMed
    1. ervantes-Salazar M., Angel-Ambrocio A. H., Soto-Acosta R., Bautista-Carbajal P., Hurtado-Monzon A. M., Alcaraz-Estrada S. L., et al. . (2015). Dengue Virus NS1 Protein Interacts With the Ribosomal Protein RPL18: This Interaction is Required for Viral Translation and Replication in Huh-7 Cells. Virology 484, 113–126. doi: 10.1016/j.virol.2015.05.017 - DOI - PubMed
    1. Deng M., Du G., Zhao J., Du X. (2017). miR-146a Negatively Regulates the Induction of Proinflammatory Cytokines in Response to Japanese Encephalitis Virus Infection in Microglial Cells. Arch. Virol. 162, 1495–1505. doi: 10.1007/s00705-017-3226-3 - DOI - PubMed
    1. Ebright R. Y., Lee S., Wittner B. S., Niederhoffer K. L., Nicholson B. T., Bardia A., et al. . (2020). Deregulation of Ribosomal Protein Expression and Translation Promotes Breast Cancer Metastasis. Science 367, 1468–1473. doi: 10.1126/science.aay0939 - DOI - PMC - PubMed

Publication types