

The Relationship Between Pediatric Gut Microbiota and SARS-CoV-2 Infection
- PMID: 35873161
- PMCID: PMC9304937
- DOI: 10.3389/fcimb.2022.908492
The Relationship Between Pediatric Gut Microbiota and SARS-CoV-2 Infection
Abstract
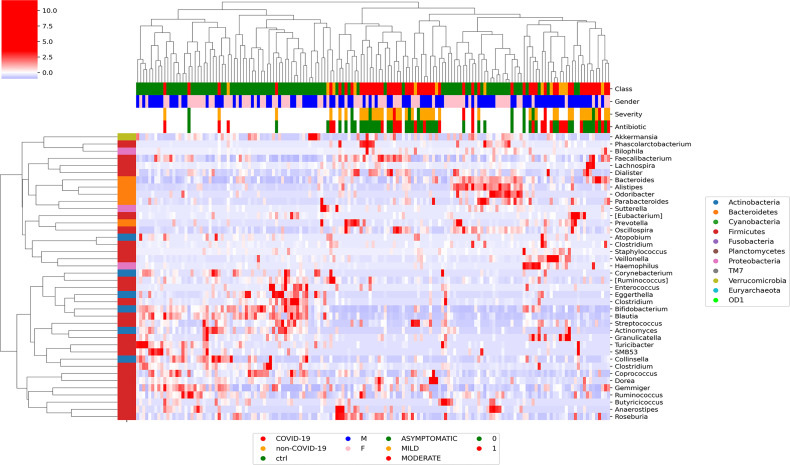
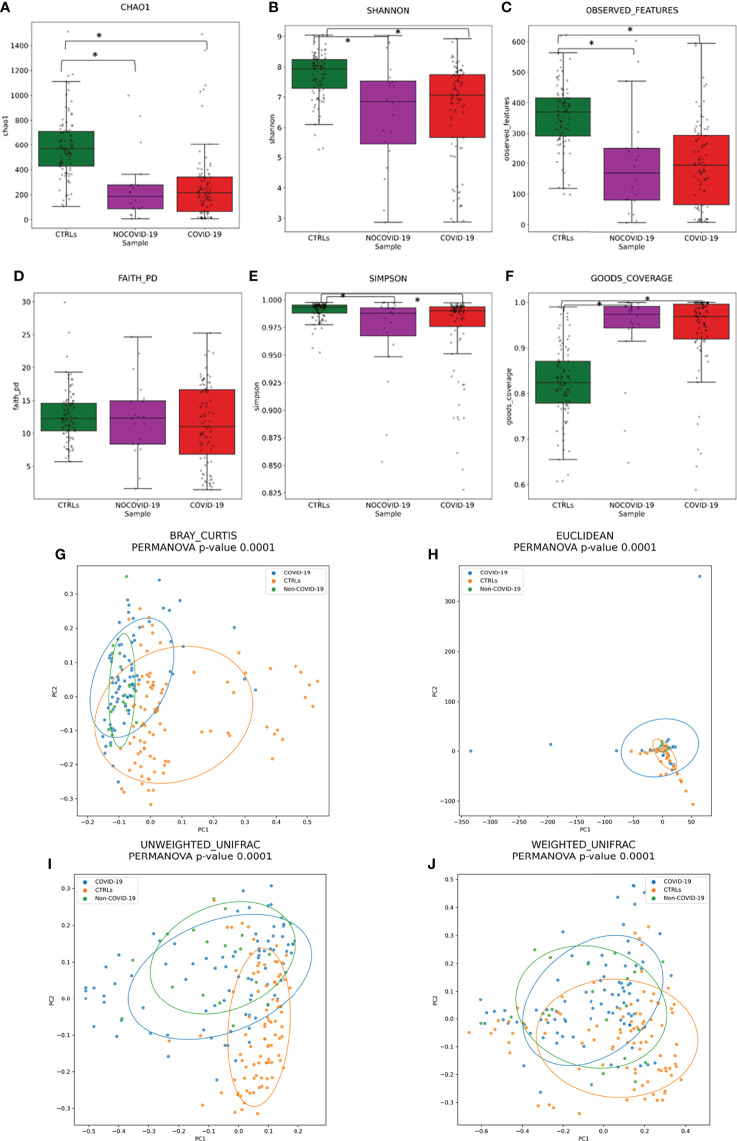
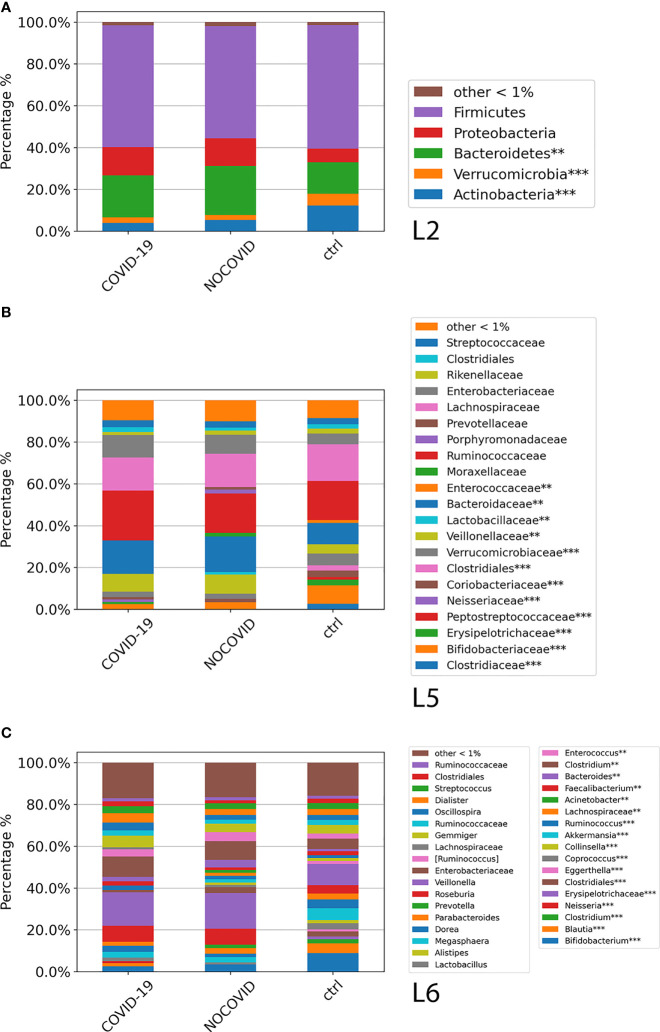
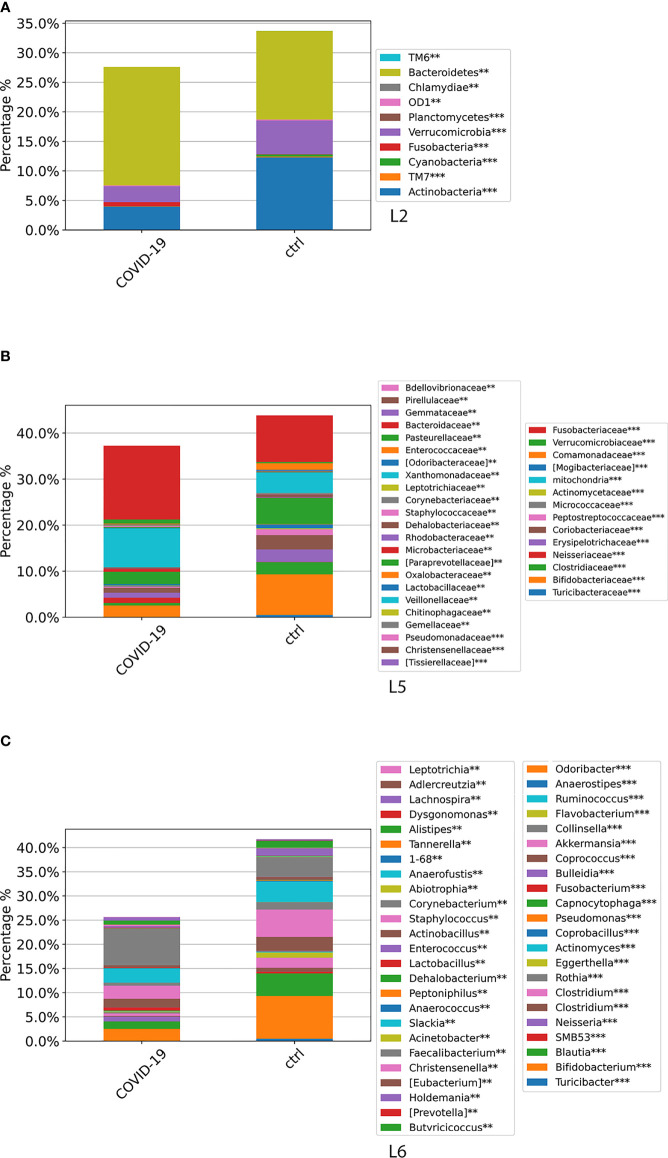
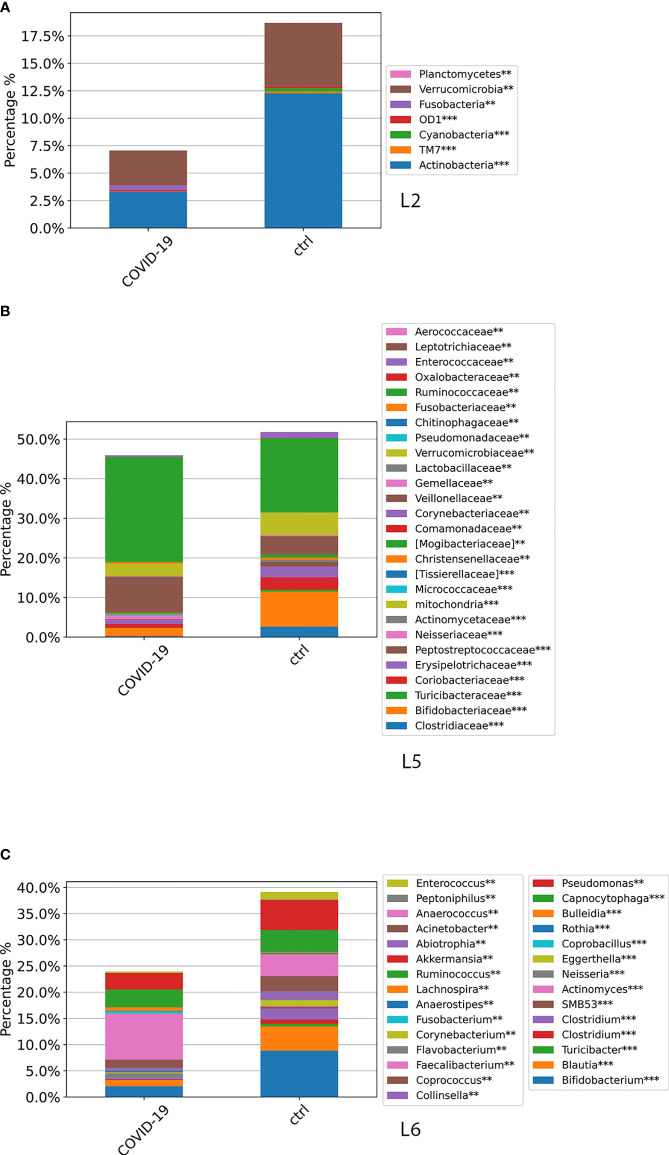
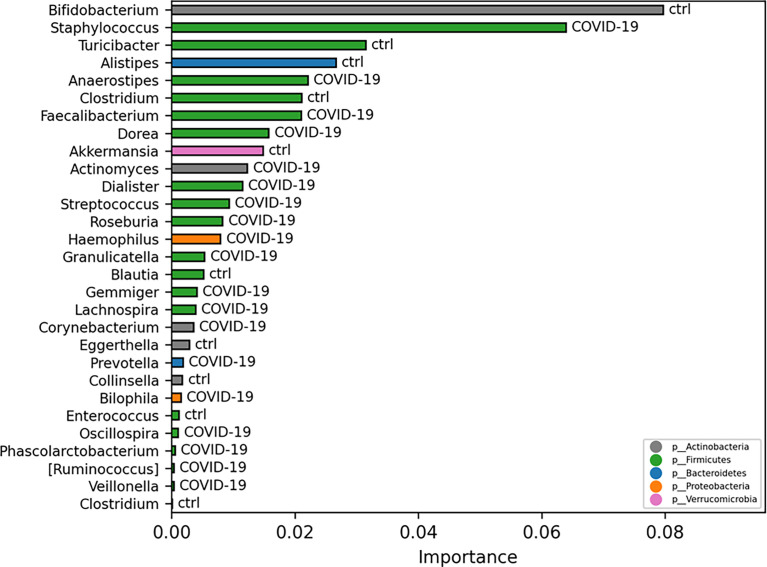
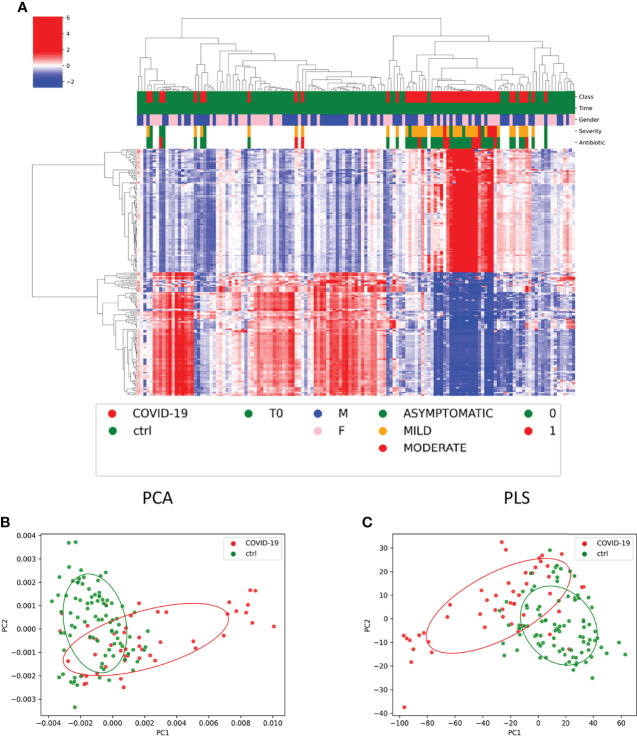
This is the first study on gut microbiota (GM) in children affected by coronavirus disease 2019 (COVID-19). Stool samples from 88 patients with suspected severe acute respiratory syndrome coronavirus 2 (SARS-CoV-2) infection and 95 healthy subjects were collected (admission: 3-7 days, discharge) to study GM profile by 16S rRNA gene sequencing and relationship to disease severity. The study group was divided in COVID-19 (68), Non-COVID-19 (16), and MIS-C (multisystem inflammatory syndrome in children) (4). Correlations among GM ecology, predicted functions, multiple machine learning (ML) models, and inflammatory response were provided for COVID-19 and Non-COVID-19 cohorts. The GM of COVID-19 cohort resulted as dysbiotic, with the lowest α-diversity compared with Non-COVID-19 and CTRLs and by a specific β-diversity. Its profile appeared enriched in Faecalibacterium, Fusobacterium, and Neisseria and reduced in Bifidobacterium, Blautia, Ruminococcus, Collinsella, Coprococcus, Eggerthella, and Akkermansia, compared with CTRLs (p < 0.05). All GM paired-comparisons disclosed comparable results through all time points. The comparison between COVID-19 and Non-COVID-19 cohorts highlighted a reduction of Abiotrophia in the COVID-19 cohort (p < 0.05). The GM of MIS-C cohort was characterized by an increase of Veillonella, Clostridium, Dialister, Ruminococcus, and Streptococcus and a decrease of Bifidobacterium, Blautia, Granulicatella, and Prevotella, compared with CTRLs. Stratifying for disease severity, the GM associated to "moderate" COVID-19 was characterized by lower α-diversity compared with "mild" and "asymptomatic" and by a GM profile deprived in Neisseria, Lachnospira, Streptococcus, and Prevotella and enriched in Dialister, Acidaminococcus, Oscillospora, Ruminococcus, Clostridium, Alistipes, and Bacteroides. The ML models identified Staphylococcus, Anaerostipes, Faecalibacterium, Dorea, Dialister, Streptococcus, Roseburia, Haemophilus, Granulicatella, Gemmiger, Lachnospira, Corynebacterium, Prevotella, Bilophila, Phascolarctobacterium, Oscillospira, and Veillonella as microbial markers of COVID-19. The KEGG ortholog (KO)-based prediction of GM functional profile highlighted 28 and 39 KO-associated pathways to COVID-19 and CTRLs, respectively. Finally, Bacteroides and Sutterella correlated with proinflammatory cytokines regardless disease severity. Unlike adult GM profiles, Faecalibacterium was a specific marker of pediatric COVID-19 GM. The durable modification of patients' GM profile suggested a prompt GM quenching response to SARS-CoV-2 infection since the first symptoms. Faecalibacterium and reduced fatty acid and amino acid degradation were proposed as specific COVID-19 disease traits, possibly associated to restrained severity of SARS-CoV-2-infected children. Altogether, this evidence provides a characterization of the pediatric COVID-19-related GM.
Keywords: COVID-19; SARS-CoV-2; diversity index; dysbiosis; gut microbiota; immunology.
Copyright © 2022 Romani, Del Chierico, Macari, Pane, Ristori, Guarrasi, Gardini, Pascucci, Cotugno, Perno, Rossi, Villani, Bernardi, Campana, Palma, Putignani and the CACTUS Study Team.
Conflict of interest statement
Author GM, VG, and SG are employed by GenomeUp SRL, Viale Pasteur, 6, 00144, Rome, Italy. The remaining authors declare that the research was conducted in the absence of any commercial or financial relationships that could be construed as a potential conflict of interest.
Figures
References
-
- Benítez-Páez A., Gómez del Pugar E. M., López-Almela I., Moya-Pérez Á., Codoñer-Franch P., Sanz Y. (2020). Depletion of Blautia Species in the Microbiota of Obese Children Relates to Intestinal Inflammation and Metabolic Phenotype Worsening. mSystems 5, e00857–e00819. doi: 10.1128/mSystems.00857-19 - DOI - PMC - PubMed
-
- Benjamini Y., Hochberg Y. (1995). Controlling the False Discovery Rate: A Practical and Powerful Approach to Multiple Testing. J. R. Stat. Soc. Series B (Methodol.) 57, 289–300. doi: 10.1111/j.2517-6161.1995.tb02031.x - DOI
Publication types
MeSH terms
Substances
Supplementary concepts
LinkOut - more resources
Full Text Sources
Medical
Research Materials
Miscellaneous