. 2022 Jun;9(1):89-107.
doi: 10.1002/gdj3.121. Epub 2021 May 4.

An updated global atmospheric paleo-reanalysis covering the last 400 years

Affiliations

An updated global atmospheric paleo-reanalysis covering the last 400 years

Veronika Valler et al. Geosci Data J. 2022 Jun.

Abstract

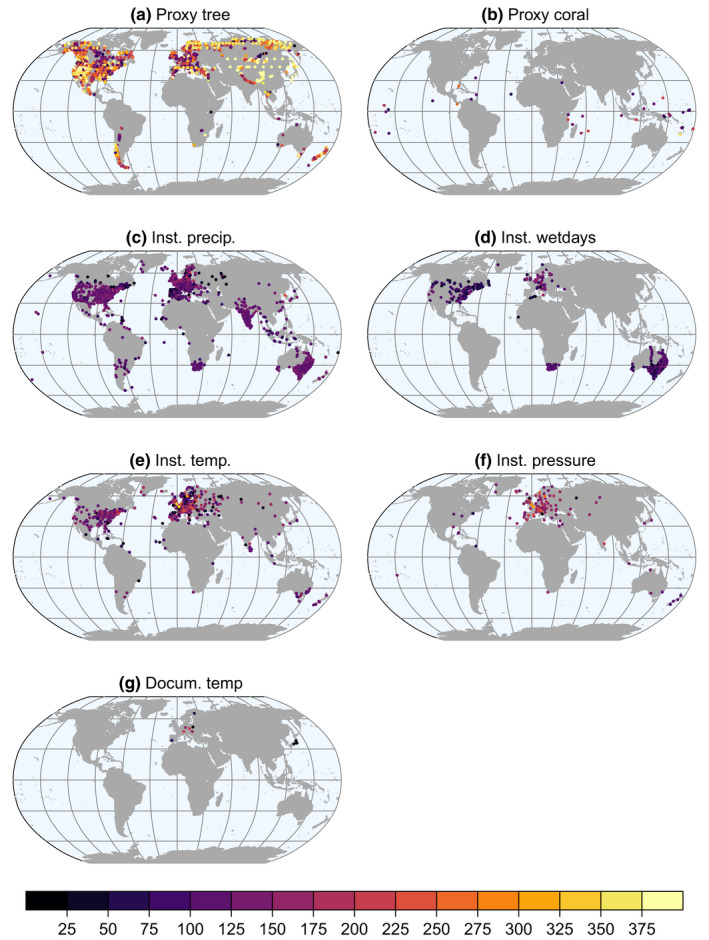
Data assimilation techniques are becoming increasingly popular for climate reconstruction. They benefit from estimating past climate states from both observation information and from model simulations. The first monthly global paleo-reanalysis (EKF400) was generated over the 1600 and 2005 time period, and it provides estimates of several atmospheric fields. Here we present a new, considerably improved version of EKF400 (EKF400v2). EKF400v2 uses atmospheric-only general circulation model simulations with a greatly extended observational network of early instrumental temperature and pressure data, documentary evidences and tree-ring width and density proxy records. Furthermore, new observation types such as monthly precipitation amounts, number of wet days and coral proxy records were also included in the assimilation. In the version 2 system, the assimilation process has undergone methodological improvements such as the background-error covariance matrix is estimated with a blending technique of a time-dependent and a climatological covariance matrices. In general, the applied modifications resulted in enhanced reconstruction skill compared to version 1, especially in precipitation, sea-level pressure and other variables beside the mostly assimilated temperature data, which already had high quality in the previous version. Additionally, two case studies are presented to demonstrate the applicability of EKF400v2 to analyse past climate variations and extreme events, as well as to investigate large-scale climate dynamics.

Keywords: climate reconstruction; ensemble Kalman fitting; paleoclimate data assimilation.


Conflict of interest statement

The authors declare that they have no conflict of interest.

Figures

FIGURE 1
FIGURE 1
Summary of different input data types and variables per year. The documentary temperature (Docum. temp.) series (purple line) is hardly visible because only 12 series are included in the input file (see Table 2)
FIGURE 2
FIGURE 2
Spatial distribution of the input data types. The colours indicate the length of each series in years
FIGURE 3
FIGURE 3
Spatial distribution of RMSESS values of temperature (a, b), precipitation (c, d) and sea‐level pressure (e, f) in the two seasons. The RMSESS is calculated using the ensemble mean of the analysis and the model simulation as well as gridded instrumental data as reference. The grey shaded areas indicate the region where no reference data are available
FIGURE 4
FIGURE 4
Spatial distribution of RMSESS values differences between EKF400v2 and EKF400v1 (EKF400v2 minus EKF400v1). The differences are calculated on the resolution of EKF400v1 for temperature (a, b), precipitation (c, d) and sea‐level pressure (e, f) in the two seasons. Positive values imply that v2 has higher skill than v1. The grey shaded areas indicate the region where no reference data are available. Note that the colour scale is nonlinear and asymmetric
FIGURE 5
FIGURE 5
Spatial distribution of correlation coefficients differences between the analysis mean of EKF400v2 and the ensemble mean of the forced simulations of temperature (a, b), precipitation (c, d) and sea‐level pressure (e, f) in the two seasons. The grey shaded areas indicate the region where no reference data are available
FIGURE 6
FIGURE 6
Monthly temperature anomalies of the independent observations (red), the analysis ensemble mean of EKF400v1 (grey) and EKF400v2 (blue). With light blue, the ensemble range of EKF400v2 is shown. The correlations (r) and the root mean square error (RMSE) between the reconstructions and the independent measurements are given on the figures. On the map, the location of observations is presented
FIGURE 7
FIGURE 7
Monthly anomalies of 500 hPa geopotential height from May to September over Europe for the dry summer years between 1726 and 1728 in EKF400v2. The yellow stars indicate the location of Padua and Uppsala
FIGURE 8
FIGURE 8
Monthly relative anomalies of precipitation from May to September over Europe for the dry summer years between 1726 and 1728 in EKF400v2. The areas left blank in the Mediterranean are regions where monthly precipitation amount is less than 10 mm in the climatology
FIGURE 9
FIGURE 9
Monthly time series comparison among EKF400v1 (grey), EKF400v2 (blue) and instrumental pressure measurements (red) between 1726 and 1728. The correlations between the reconstructions and the independent measurements are given on the figures
FIGURE 10
FIGURE 10
Composite figure of temperature anomaly [K] and precipitation anomaly [mm], calculated from the La Niña years in the 19th century (1801, 1820, 1822, 1835, 1842, 1847, 1863, 1872, 1887, 1890, 1893; based on Brönnimann et al., (2007)). The composite of ensemble mean of the model simulation (a, d), the EKF400v1 (b, e) and the EKF400v2 (c, f) are shown

Similar articles

Cited by

References

    1. Alcoforado, M.J. , Vaquero, J. , Trigo, R. & Taborda, J. (2012) Early Portuguese meteorological measurements (18th century). Climate of the Past, 8, 353–371. 10.5194/cp-8-353-2012 - DOI
    1. Allan, R. & Ansell, T. (2006) A new globally complete monthly historical gridded mean sea level pressure dataset (HadSLP2): 1850–2004. Journal of Climate, 19, 5816–5842. 10.1175/JCLI3937.1 - DOI
    1. Aono, Y. (2015) Cherry blossom phenological data since the seventeenth century for Edo (Tokyo), Japan, and their application to estimation of March temperatures, International Journal of Biometeorology, 59, 427–434. 10.1007/s00484-014-0854-0 - DOI - PubMed
    1. Aono, Y. & Kazui, K. (2008) Phenological data series of cherry tree owering in Kyoto, Japan, and its application to reconstruction of springtime temperatures since the 9th century. International Journal of Climatology, 28, 905–914. Wiley Online Library. 10.1002/joc.1594 - DOI
    1. Aono, Y. & Tani, A. (2014) Autumn temperature deduced from historical records of autumn tints phenology of maple tree in Kyoto, Japan. Climate in Biosphere (in Japanese with English abstract), 14, 18–28. 10.2480/cib.J-14-023 - DOI

LinkOut - more resources