. 2022 Jul 6:9:920362.
doi: 10.3389/fnut.2022.920362. eCollection 2022.

Infant Formula With a Specific Blend of Five Human Milk Oligosaccharides Drives the Gut Microbiota Development and Improves Gut Maturation Markers: A Randomized Controlled Trial

Collaborators, Affiliations

Infant Formula With a Specific Blend of Five Human Milk Oligosaccharides Drives the Gut Microbiota Development and Improves Gut Maturation Markers: A Randomized Controlled Trial

Miroslava Bosheva et al. Front Nutr. .

Abstract

Background: Human milk oligosaccharides (HMOs) have important biological functions for a healthy development in early life.

Objective: This study aimed to investigate gut maturation effects of an infant formula containing five HMOs (2'-fucosyllactose, 2',3-di-fucosyllactose, lacto-N-tetraose, 3'-sialyllactose, and 6'-sialyllactose).

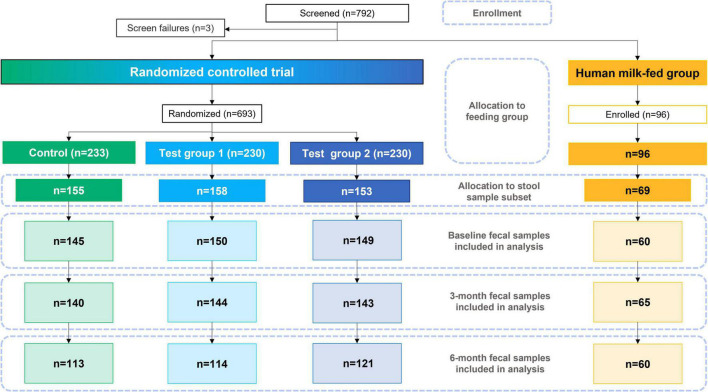
Methods: In a multicenter study, healthy infants (7-21 days old) were randomly assigned to a standard cow's milk-based infant formula (control group, CG); the same formula with 1.5 g/L HMOs (test group 1, TG1); or with 2.5 g/L HMOs (test group 2, TG2). A human milk-fed group (HMG) was enrolled as a reference. Fecal samples collected at baseline (n∼150/formula group; HMG n = 60), age 3 (n∼140/formula group; HMG n = 65) and 6 (n∼115/formula group; HMG n = 60) months were analyzed for microbiome (shotgun metagenomics), metabolism, and biomarkers.

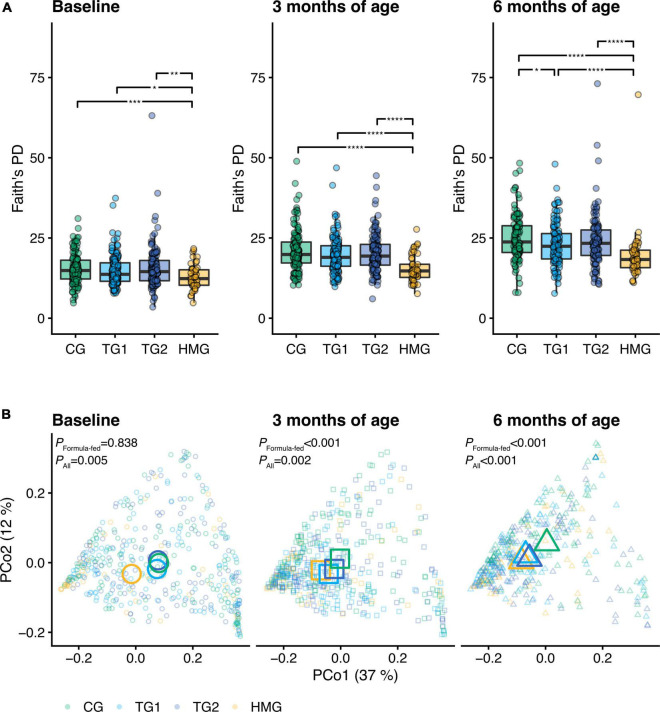
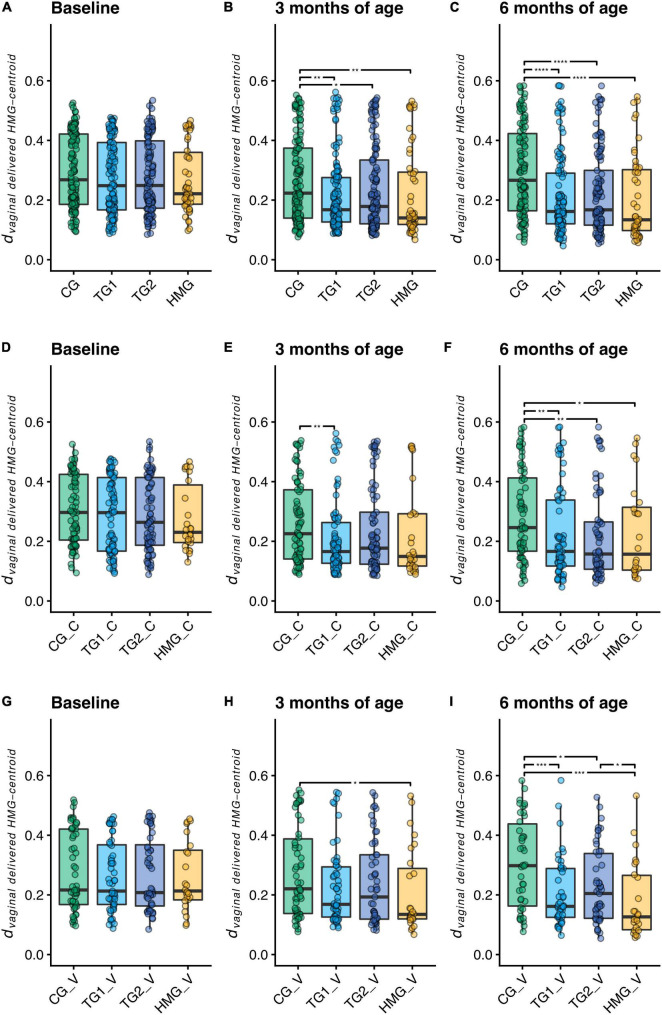
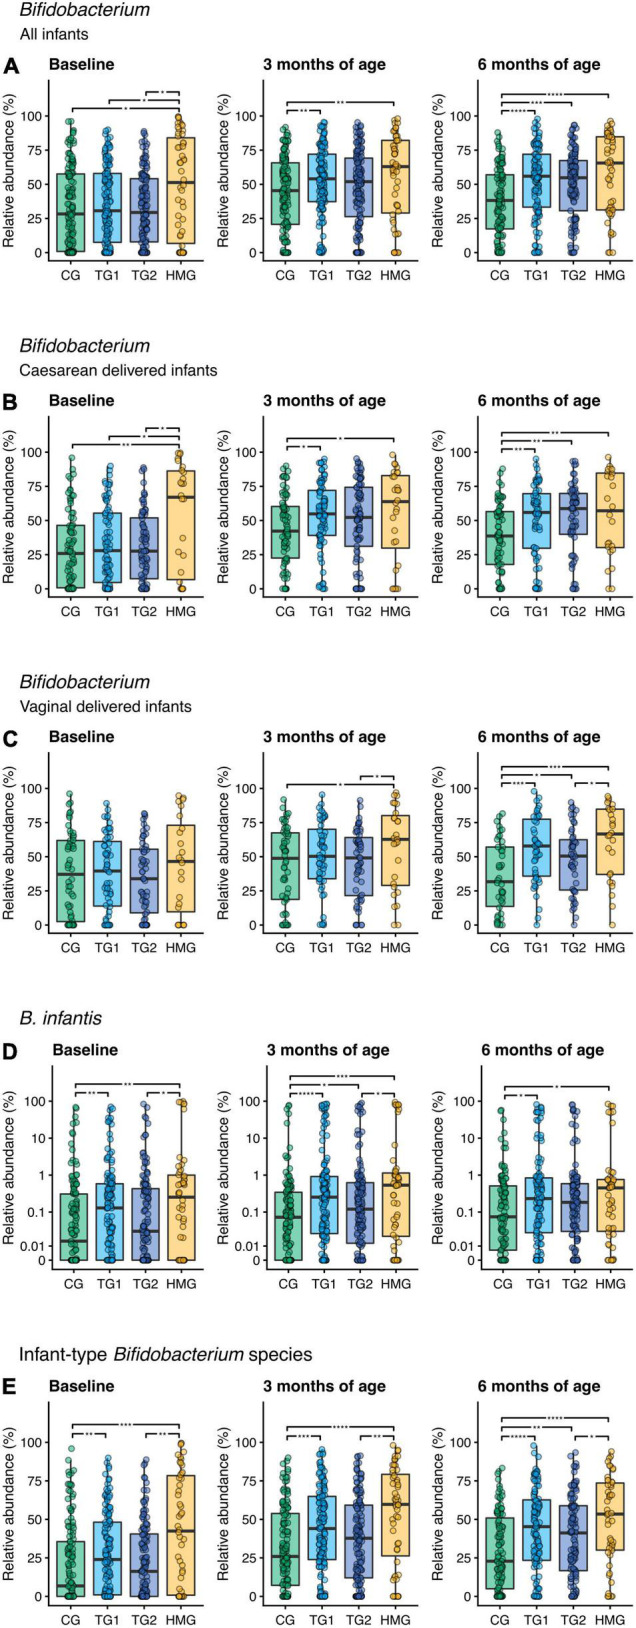
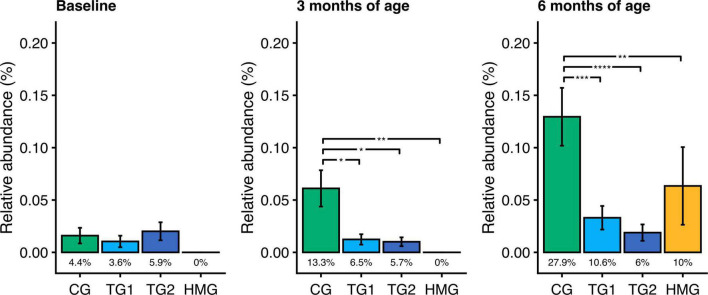
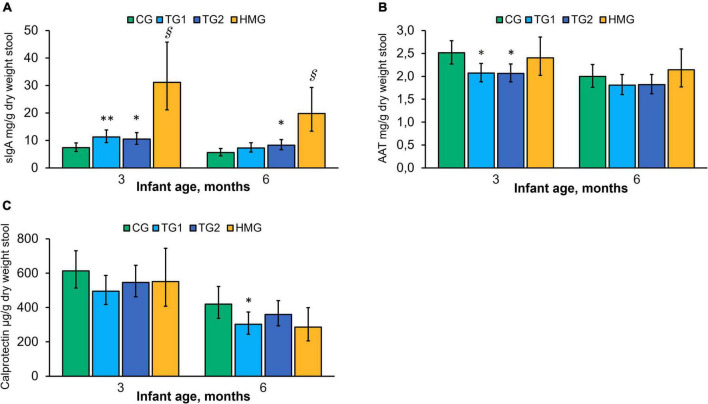
Results: At both post-baseline visits, weighted UniFrac analysis indicated different microbiota compositions in the two test groups (TGs) compared to CG (P < 0.01) with coordinates closer to that of HMG. The relative abundance of Bifidobacterium longum subsp. infantis (B. infantis) was higher in TGs vs. CG (P < 0.05; except at 6 months: TG2 vs. CG P = 0.083). Bifidobacterium abundance was higher by ∼45% in TGs vs. CG at 6-month approaching HMG. At both post-baseline visits, toxigenic Clostridioides difficile abundance was 75-85% lower in TGs vs. CG (P < 0.05) and comparable with HMG. Fecal pH was significantly lower in TGs vs. CG, and the overall organic acid profile was different in TGs vs. CG, approaching HMG. At 3 months, TGs (vs. CG) had higher secretory immunoglobulin A (sIgA) and lower alpha-1-antitrypsin (P < 0.05). At 6 months, sIgA in TG2 vs. CG remained higher (P < 0.05), and calprotectin was lower in TG1 (P < 0.05) vs. CG.

Conclusion: Infant formula with a specific blend of five HMOs supports the development of the intestinal immune system and gut barrier function and shifts the gut microbiome closer to that of breastfed infants with higher bifidobacteria, particularly B. infantis, and lower toxigenic Clostridioides difficile.

Clinical trial registration: [https://clinicaltrials.gov/ct2/show/], identifier [NCT03722550].

Keywords: Bifidobacterium longum subsp. infantis (B. infantis); Clostridioides (C.) difficile; bifidobacteria; gut maturation; gut microbiota; human milk oligosaccharides (HMOs); infant formula; intestinal immune response.


Conflict of interest statement

This study received funding from Nestlé Nutrition, Société des Produits Nestlé S.A., Switzerland. DG, NS, BB, and CC were current employees of the funder. The funder had the following involvement with the study: study design, data analysis, decision to publish, and preparation of the manuscript. HP, OL, and AE were employees of Clinical Microbiomics, Denmark, which was involved in the sample and data analysis. The remaining authors declare that the research was conducted in the absence of any commercial or financial relationships that could be construed as a potential conflict of interest.

Figures

FIGURE 1
FIGURE 1
Study participant flowchart. Control was without HMOs; test group 1 was with 1.5 g HMOs/L; test group 2 with 2.5 g HMOs/L. HMOs human milk oligosaccharides.
FIGURE 2
FIGURE 2
(A) Alpha diversity (Faith’s phylogenetic diversity) of the gut microbiota of the infants in the four feeding groups at each timepoint (baseline left, 3 months of age center, 6 months of age right). Box plots show the median and 25th and 75th percentiles with Tukey whiskers. Within each timepoint, all feeding groups were compared pairwise (Dunn’s test), and significant differences are highlighted with significance bars. *P < 0.05, **P < 0.01, ***P < 0.001, ****P < 0.0001. (B) Principal coordinates analysis (PCoA) based on weighted UniFrac distance. Feeding groups are color-coded and faceted by timepoint. Individual data points are shown, with the mean (centroid) of each group indicated as a larger symbol. The x- and y-axis labels indicate the microbial variance explained by the first two principal coordinates. P-values for permutational multivariate analysis of variance (PERMANOVA) using feeding group as explanatory variable are shown for all infants and the subset of formula-fed infants at each visit. At baseline/3/6 month of age, CG, n = 135/135/111; TG1, n = 140/138/113; TG2, n = 136/140/117; HMG, n = 50/55/50. CG, control group; TG1, test group 1 (1.5 g HMOs/L); TG2, test group 2 (1.5 g HMOs/L); HMG, human milk-fed group; HMOs, human milk oligosaccharides.
FIGURE 3
FIGURE 3
Distance to the centroid of vaginally delivered HMG infants in principal coordinates analysis space of weighted UniFrac distance (dvaginal delivered HMG–centroid) at each timepoint for all infants (A–C), cesarean-delivered infants (D–F, indicated with “_C” in the labels), and vaginally delivered infants (G–I, indicated with “_V” in the labels). Box plots show the median and 25th and 75th percentiles with Tukey whiskers. Within each timepoint, all groups were compared pairwise with Mann–Whitney U tests, and significant differences are highlighted with significance bars. *P < 0.05, **P < 0.01, ***P < 0.001, ****P < 0.0001. At baseline/3/6 month of age, CG, n = 135/135/111; TG1, n = 140/138/113; TG2, n = 136/140/117; HMG, n = 50/55/50 for all infants (A–C), CG, n = 79/77/69; TG1, n = 81/82/66; TG2, n = 80/85/66; HMG, n = 26/28/24 for cesarean-delivered infants (D–F), CG, n = 56/58/42; TG1, n = 59/56/47; TG2, n = 56/55/51; HMG, n = 24/27/26 for vaginally delivered infants (G–I). CG, control group; TG1, test group 1 (1.5 g HMOs/L); TG2, test group 2 (1.5 g HMOs/L); HMG, human milk-fed group; HMOs, human milk oligosaccharides.
FIGURE 4
FIGURE 4
Relative abundance of (A) Bifidobacterium including all infants, (B) Bifidobacterium in cesarean-delivered infants, (C) Bifidobacterium in vaginally delivered infants, (D) Bifidobacterium longum subsp. infantis (B. infantis), and (E) infant-type Bifidobacterium species in the four feeding groups at each timepoint (baseline left, 3 months of age center, 6 months of age right). Infant-type Bifidobacterium species is defined as the summarized relative abundance of B. longum subsp. infantis, B. longum subsp. longum, B. bifidum, and B. breve (36). Box plots show the median and 25th and 75th percentiles with Tukey whiskers. Relative abundance of B. infantis is plotted on a pseudo-logarithmic scale to display values spanning several orders of magnitude, as well as zeros. Within each timepoint, all feeding groups were compared pairwise (Dunn’s test), and significant differences are highlighted with significance bars. *P < 0.05, **P < 0.01, ***P < 0.001, ****P < 0.0001. At baseline/3/6 month of age, CG, n = 135/135/111; TG1, n = 140/138/113; TG2, n = 136/140/117; HMG, n = 50/55/50 for all infants (A,D,E), CG, n = 79/77/69; TG1, n = 81/82/66; TG2, n = 80/85/66; HMG, n = 26/28/24 for cesarean-delivered infants (B), CG, n = 56/58/42; TG1, n = 59/56/47; TG2, n = 56/55/51; HMG, n = 24/27/26 for vaginally delivered infants (C). CG, control group; TG1, test group 1 (1.5 g HMOs/L); TG2, test group 2 (1.5 g HMOs/L); HMG, human milk-fed group; HMOs, human milk oligosaccharides.
FIGURE 5
FIGURE 5
Relative abundance of toxigenic Clostridioides difficile in the four feeding groups at each timepoint (baseline left, 3 months of age center, 6 months of age right). Bars show the mean relative abundance with error bars indicating the standard error. Prevalence for each group (percentage of infants with detectable levels of toxigenic C. difficile) is displayed below the bar. Within each timepoint, the relative abundance of C. difficile in all feeding groups were compared pairwise (Dunn’s test), and significant differences are highlighted with significance bars. *P < 0.05, **P < 0.01, ***P < 0.001, ****P < 0.0001. At baseline/3/6 months of age, CG, n = 135/135/111; TG1, n = 140/138/113; TG2, n = 136/140/117; HMG, n = 50/55/50. CG, control group; TG1, test group 1 (1.5 g HMOs/L); TG2, test group 2 (1.5 g HMOs/L); HMG, human milk-fed group; HMOs, human milk oligosaccharides.
FIGURE 6
FIGURE 6
Concentration of sIgA (A), AAT (B), and calprotectin (C) in the four feeding groups at 3 and 6 months of age. Data presented as adjusted means with the 95% CI as whiskers and expressed per gram fecal dry weight. Within each timepoint, all feeding groups were compared pairwise using ANCOVA models adjusted for baseline value of the measure of interest. *P < 0.05 vs. CG; **P < 0.01 vs. CG; § P < 0.001 vs. all formula groups. At 3/6 months of age, CG, n = 102/85; TG1, n = 110/90; TG2, n = 113/99; HMG, n = 35/37 for sIgA; CG, n = 102/85; TG1, n = 109/88; TG2, n = 112/99; HMG, n = 34/36 for AAT; CG, n = 102/85; TG1, n = 110/89; TG2, n = 113/99; HMG, n = 35/37 for calprotectin. AAT, alpha-1-antitrypsin; CG, control group; TG1, test group 1 (1.5 g HMOs/L); TG2, test group 2 (1.5 g HMOs/L); HMG, human milk-fed group; HMOs, human milk oligosaccharides; sIgA, secretory IgA.

References

    1. Bode L. Human milk oligosaccharides: every baby needs a sugar mama. Glycobiology. (2012) 22:1147–62. 10.1093/glycob/cws074 - DOI - PMC - PubMed
    1. Sanchez C, Fente C, Regal P, Lamas A, Lorenzo MP. Human Milk Oligosaccharides (HMOs) and infant microbiota: a scoping review. Foods. (2021) 10:1429. 10.3390/foods10061429 - DOI - PMC - PubMed
    1. Bao Y, Chen C, Newburg DS. Quantification of neutral human milk oligosaccharides by graphitic carbon high-performance liquid chromatography with tandem mass spectrometry. Anal Biochem. (2013) 433:28–35. 10.1016/j.ab.2012.10.003 - DOI - PMC - PubMed
    1. Coppa GV, Pierani P, Zampini L, Carloni I, Carlucci A, Gabrielli O. Oligosaccharides in human milk during different phases of lactation. Acta Paediatr Suppl. (1999) 88:89–94. 10.1111/j.1651-2227.1999.tb01307.x - DOI - PubMed
    1. Hamosh M. Bioactive factors in human milk. Pediatr Clin North Am. (2001) 48:69–86. - PubMed

Associated data