

Identification of TLR2 as a Key Target in Neuroinflammation in Vascular Dementia
- PMID: 35873459
- PMCID: PMC9296774
- DOI: 10.3389/fgene.2022.860122
Identification of TLR2 as a Key Target in Neuroinflammation in Vascular Dementia
Abstract
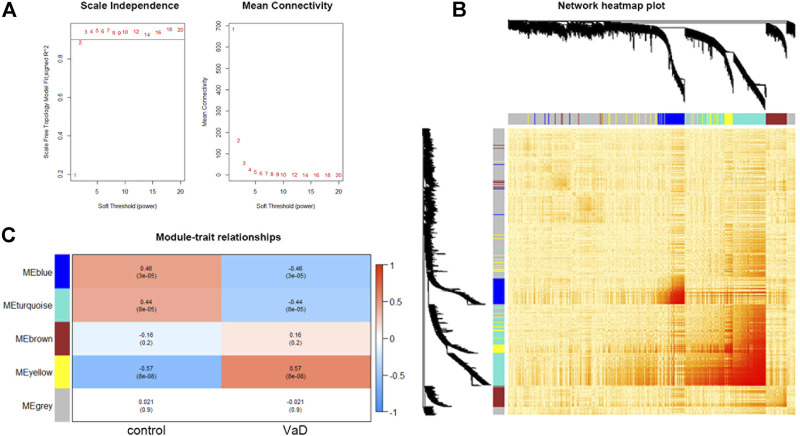
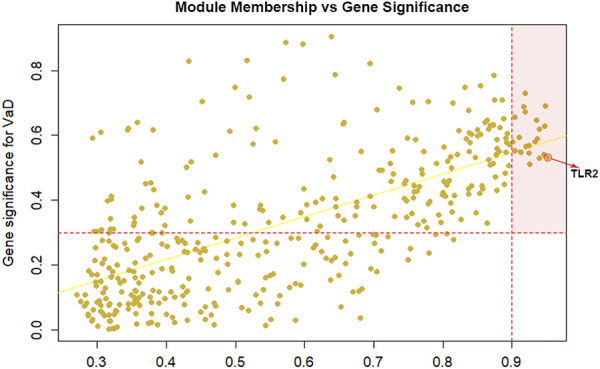
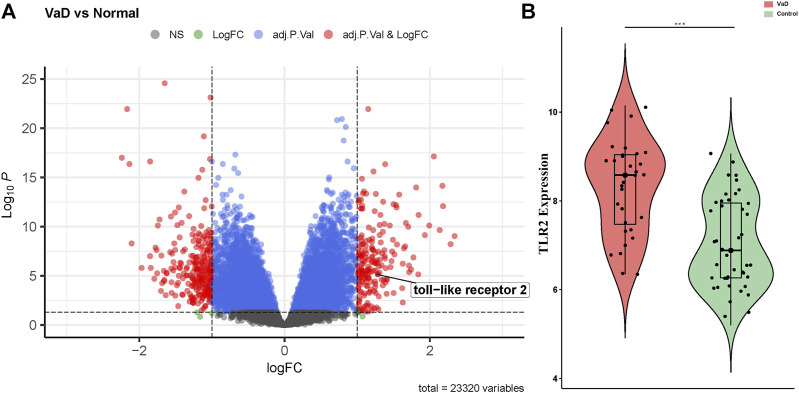
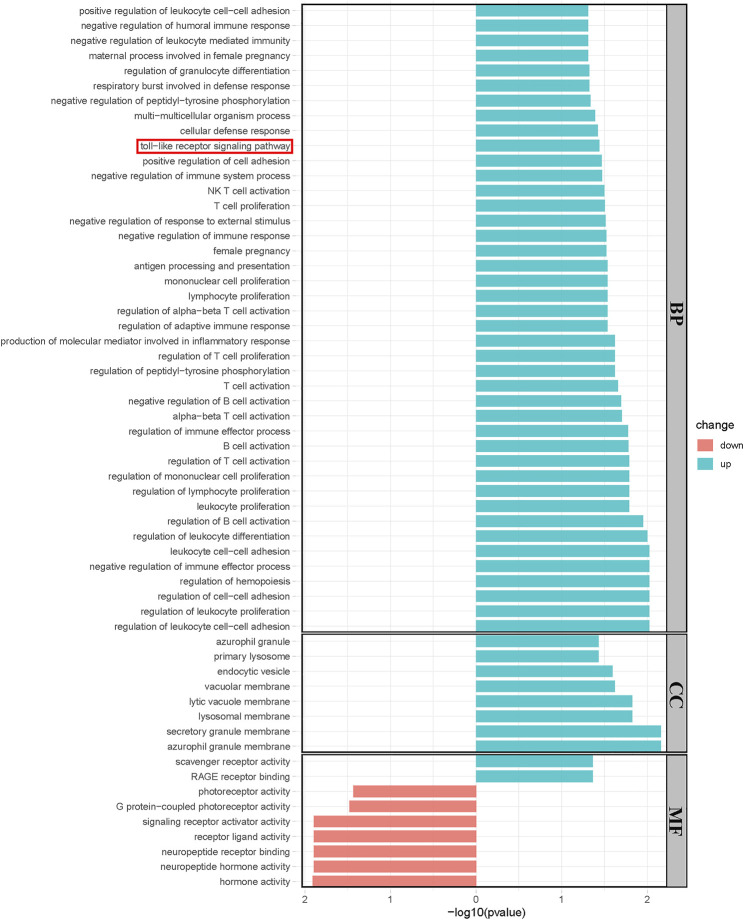
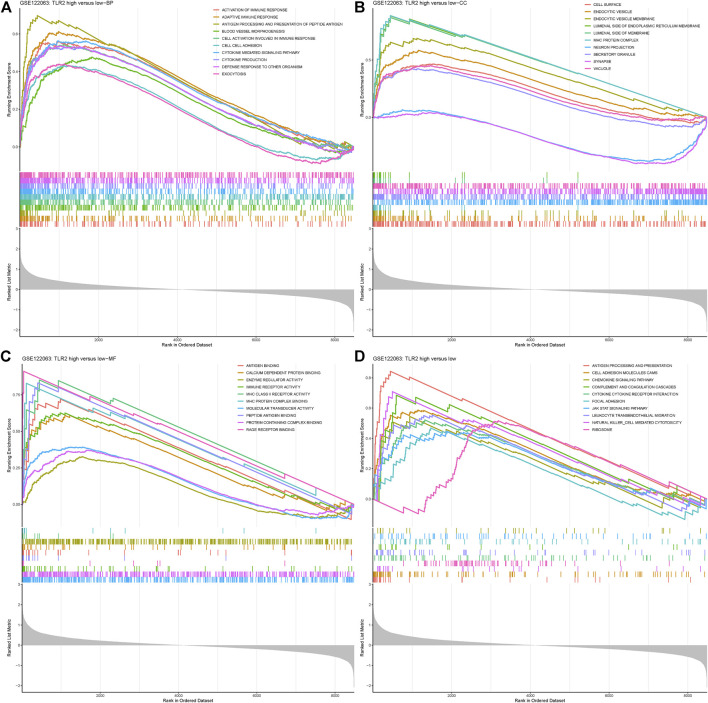
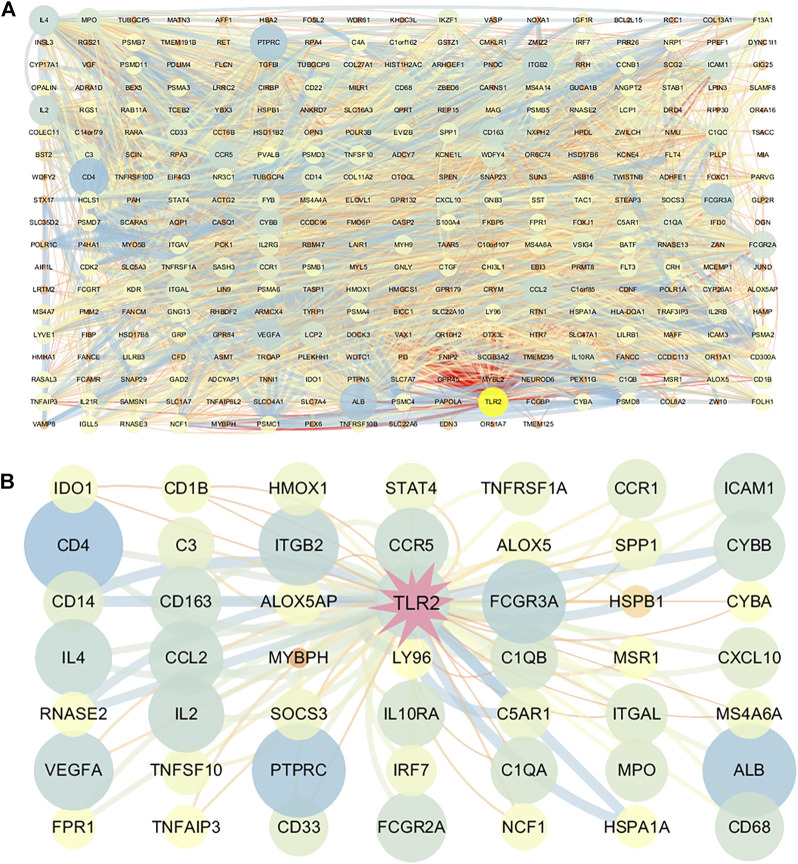
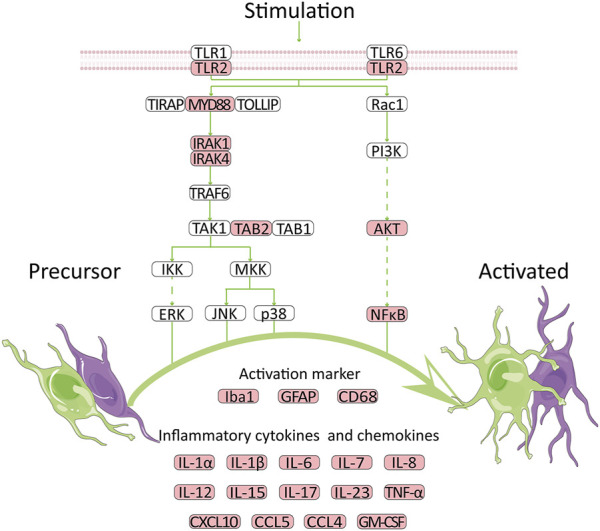
Vascular dementia (VaD) is the second most common cause of dementia. At present, precise molecular processes of VaD are unclear. We attempted to discover the VaD relevant candidate genes, enrichment biological processes and pathways, key targets, and the underlying mechanism by microarray bioinformatic analysis. We selected GSE122063 related to the autopsy samples of VaD for analysis. We first took use of Weighted Gene Co-expression Network Analysis (WGCNA) to achieve modules related to VaD and hub genes. Second, we filtered out significant differentially expressed genes (DEGs). Third, significant DEGs then went through Geno Ontology and Kyoto Encyclopedia of Genes and Genomes (KEGG) analysis. Fourth, Gene Set Enrichment Analysis (GSEA) was performed. At last, we constructed the protein-protein interaction (PPI) network. The results showed that the yellow module had the strongest correlation with VaD, and we finally identified 21 hub genes. Toll-like receptor 2 (TLR2) was the top hub gene and was strongly correlated with other possible candidate genes. In total, 456 significant DEGs were filtered out and these genes were found to be enriched in the Toll receptor signaling pathway and several other immune-related pathways. In addition, Gene Set Enrichment Analysis results showed that similar pathways were significantly over-represented in TLR2-high samples. In the PPI network, TLR2 was still an important node with high weight and combined scores. We concluded that the TLR2 acts as a key target in neuroinflammation which may participate in the pathophysiological process of VaD.
Keywords: TLR2; WGCNA; bioinformatic analysis; neuroinflammation; vascular dementia.
Copyright © 2022 Wang, Lv, Zhou, Niu, Chen, Yang and Peng.
Conflict of interest statement
The authors declare that the research was conducted in the absence of any commercial or financial relationships that could be construed as a potential conflict of interest.
Figures
Similar articles
-
Identification of hub biomarkers of myocardial infarction by single-cell sequencing, bioinformatics, and machine learning.Front Cardiovasc Med. 2022 Jul 25;9:939972. doi: 10.3389/fcvm.2022.939972. eCollection 2022. Front Cardiovasc Med. 2022. PMID: 35958412 Free PMC article.
-
Identification of toll-like receptor 2 as a key regulator of neuronal apoptosis in vascular dementia by bioinformatics analysis and experimental validation.Exp Gerontol. 2024 Aug;193:112464. doi: 10.1016/j.exger.2024.112464. Epub 2024 Jun 10. Exp Gerontol. 2024. PMID: 38797288
-
Bioinformatic identification of potential biomarkers and therapeutic targets in carotid atherosclerosis and vascular dementia.Front Neurol. 2023 Jan 10;13:1091453. doi: 10.3389/fneur.2022.1091453. eCollection 2022. Front Neurol. 2023. PMID: 36703641 Free PMC article.
-
The identification of key genes and pathways in hepatocellular carcinoma by bioinformatics analysis of high-throughput data.Med Oncol. 2017 Jun;34(6):101. doi: 10.1007/s12032-017-0963-9. Epub 2017 Apr 21. Med Oncol. 2017. PMID: 28432618 Free PMC article.
-
Identification of the pivotal role of SPP1 in kidney stone disease based on multiple bioinformatics analysis.BMC Med Genomics. 2022 Jan 11;15(1):7. doi: 10.1186/s12920-022-01157-4. BMC Med Genomics. 2022. PMID: 35016690 Free PMC article.
Cited by
-
Identification of potential drug targets for vascular dementia and carotid plaques by analyzing underlying molecular signatures shared by them.Front Aging Neurosci. 2022 Oct 3;14:967146. doi: 10.3389/fnagi.2022.967146. eCollection 2022. Front Aging Neurosci. 2022. PMID: 36262886 Free PMC article.
-
Transcriptome analysis reveals potential marker genes for diagnosis of Alzheimer's disease and vascular dementia.Front Genet. 2022 Nov 24;13:1038585. doi: 10.3389/fgene.2022.1038585. eCollection 2022. Front Genet. 2022. PMID: 36506318 Free PMC article.
-
An Update on Toll-like Receptor 2, Its Function and Dimerization in Pro- and Anti-Inflammatory Processes.Int J Mol Sci. 2023 Aug 5;24(15):12464. doi: 10.3390/ijms241512464. Int J Mol Sci. 2023. PMID: 37569837 Free PMC article. Review.
References
-
- Blighe K., Rana S., Lewis M. (2018). EnhancedVolcano: Publication-Ready Volcano Plots with Enhanced Colouring and Labeling. Available at: https://github.com/kevinblighe/EnhancedVolcano . (Accessed May 4, 2022).
-
- Carlson M. (2021). org.Hs.eg.db: Genome Wide Annotation for Human. R package version 3.14.0.
LinkOut - more resources
Full Text Sources