

Chromatin Separation Regulators Predict the Prognosis and Immune Microenvironment Estimation in Lung Adenocarcinoma
- PMID: 35873497
- PMCID: PMC9305311
- DOI: 10.3389/fgene.2022.917150
Chromatin Separation Regulators Predict the Prognosis and Immune Microenvironment Estimation in Lung Adenocarcinoma
Abstract
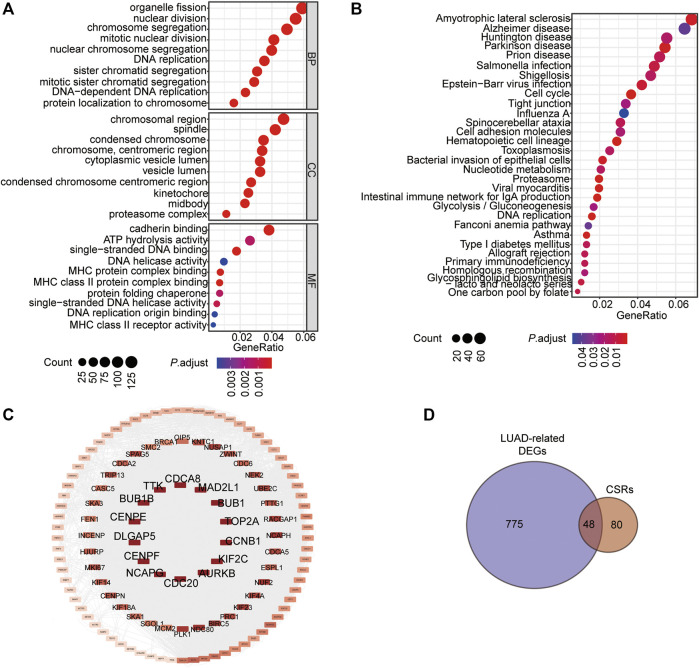
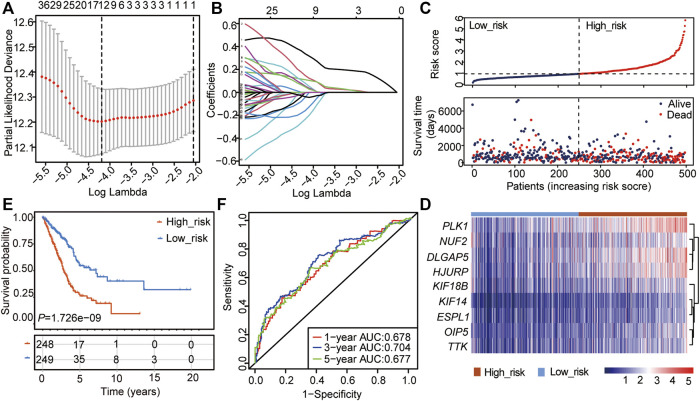
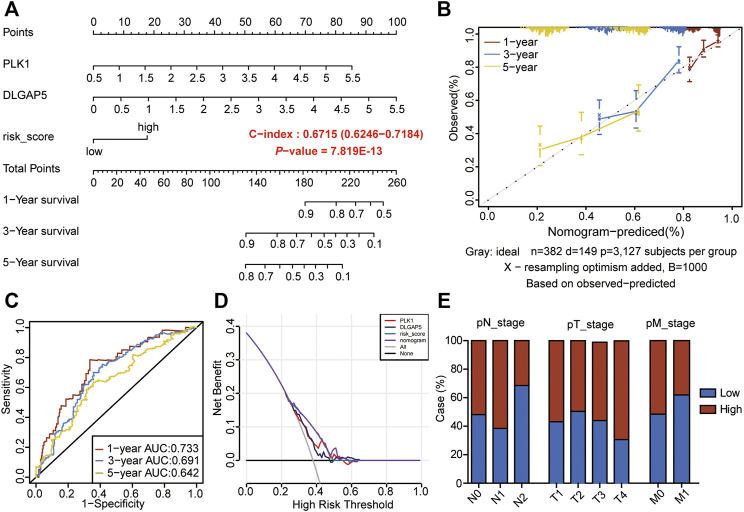
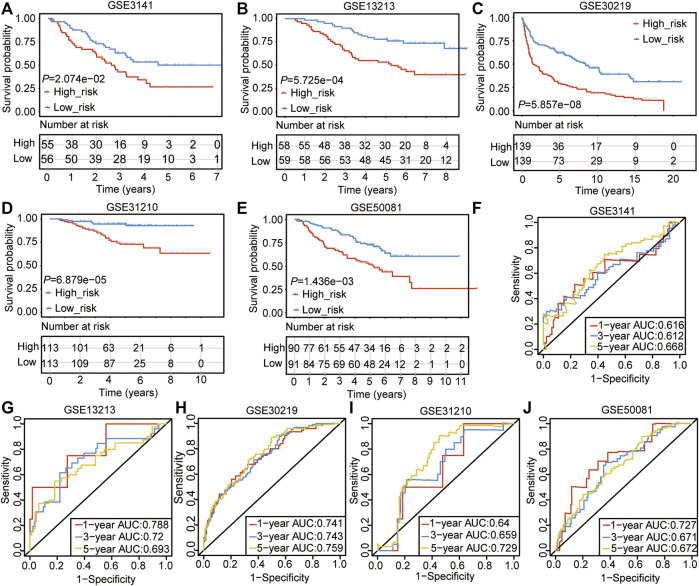
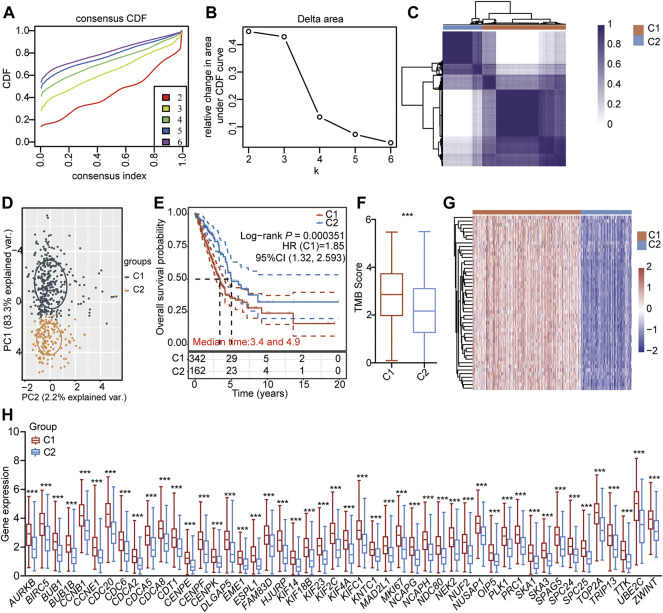
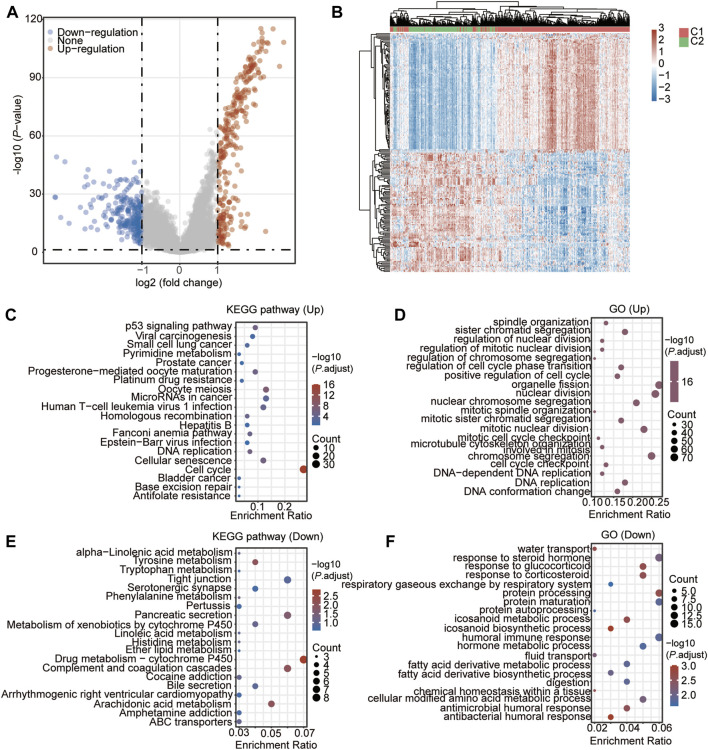
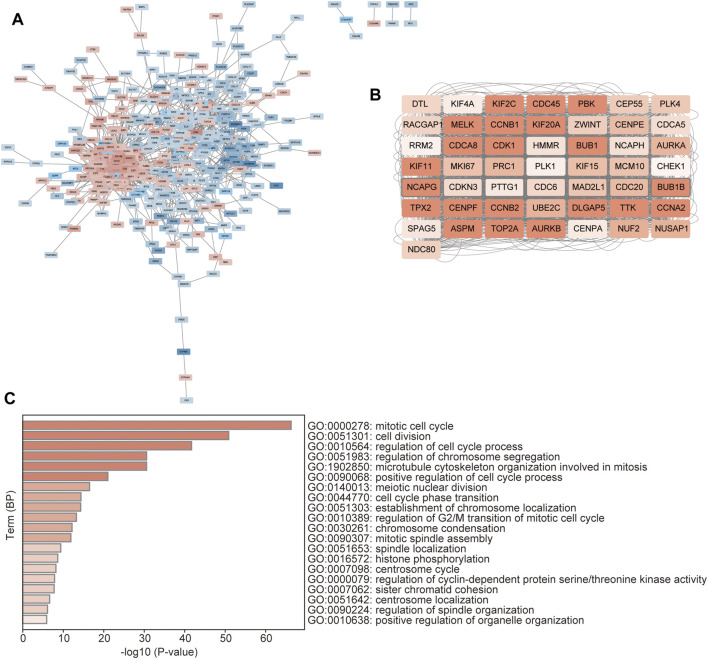
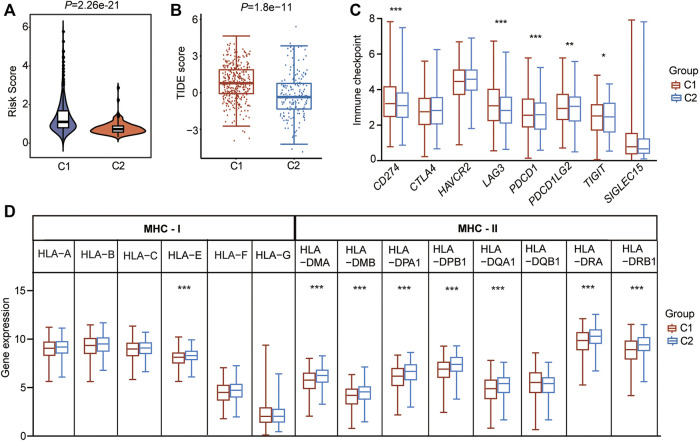
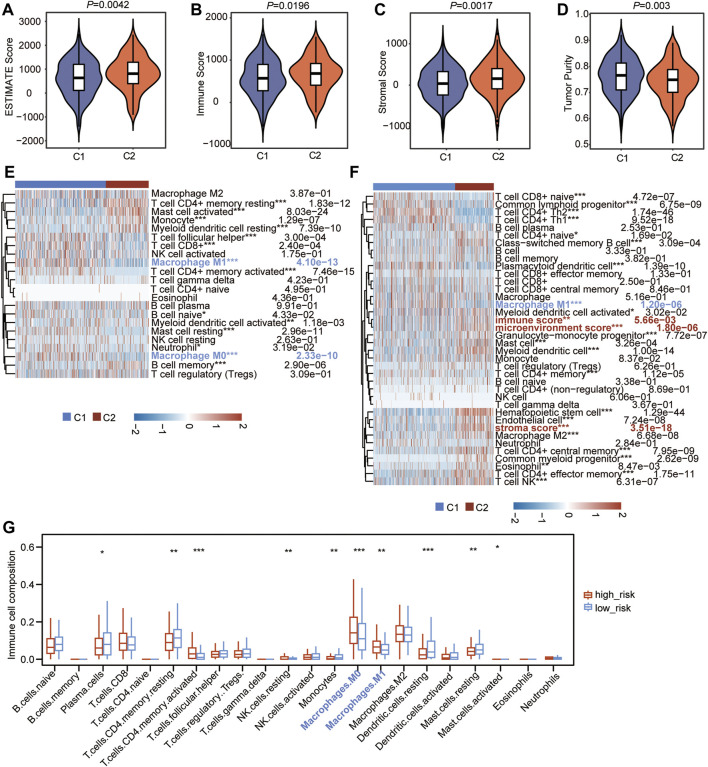
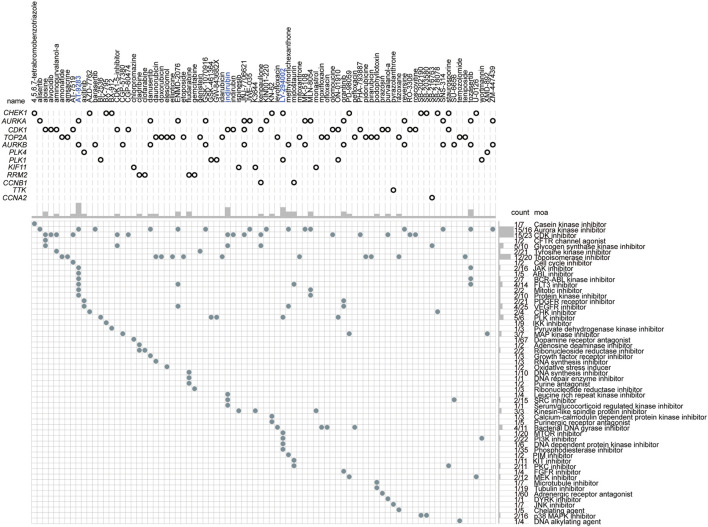
Background: Abnormal chromosome segregation is identified to be a common hallmark of cancer. However, the specific predictive value of it in lung adenocarcinoma (LUAD) is unclear. Method: The RNA sequencing and the clinical data of LUAD were acquired from The Cancer Genome Atlas (TACG) database, and the prognosis-related genes were identified. The Kyoto Encyclopedia of Genes and Genomes (KEGG) and Gene Ontology (GO) were carried out for functional enrichment analysis of the prognosis genes. The independent prognosis signature was determined to construct the nomogram Cox model. Unsupervised clustering analysis was performed to identify the distinguishing clusters in LUAD-samples based on the expression of chromosome segregation regulators (CSRs). The differentially expressed genes (DEGs) and the enriched biological processes and pathways between different clusters were identified. The immune environment estimation, including immune cell infiltration, HLA family genes, immune checkpoint genes, and tumor immune dysfunction and exclusion (TIDE), was assessed between the clusters. The potential small-molecular chemotherapeutics for the individual treatments were predicted via the connectivity map (CMap) database. Results: A total of 2,416 genes were determined as the prognosis-related genes in LUAD. Chromosome segregation is found to be the main bioprocess enriched by the prognostic genes. A total of 48 CSRs were found to be differentially expressed in LUAD samples and were correlated with the poor outcome in LUAD. Nine CSRs were identified as the independent prognostic signatures to construct the nomogram Cox model. The LUAD-samples were divided into two distinct clusters according to the expression of the 48 CSRs. Cell cycle and chromosome segregation regulated genes were enriched in cluster 1, while metabolism regulated genes were enriched in cluster 2. Patients in cluster 2 had a higher score of immune, stroma, and HLA family components, while those in cluster 1 had higher scores of TIDES and immune checkpoint genes. According to the hub genes highly expressed in cluster 1, 74 small-molecular chemotherapeutics were predicted to be effective for the patients at high risk. Conclusion: Our results indicate that the CSRs were correlated with the poor prognosis and the possible immunotherapy resistance in LUAD.
Keywords: bioinformatics; chromosome segregation regulators; immune environment; lung adenocarcinoma; prognostic signature.
Copyright © 2022 Li, Ma, Xue, Shen, Qin, Zhang, Zheng and Zhang.
Conflict of interest statement
The authors declare that the research was conducted in the absence of any commercial or financial relationships that could be construed as a potential conflict of interest.
Figures
Similar articles
-
A Four-Gene Prognostic Signature Based on the TEAD4 Differential Expression Predicts Overall Survival and Immune Microenvironment Estimation in Lung Adenocarcinoma.Front Pharmacol. 2022 May 4;13:874780. doi: 10.3389/fphar.2022.874780. eCollection 2022. Front Pharmacol. 2022. PMID: 35600867 Free PMC article.
-
Prognostic model of lung adenocarcinoma based on immunoprognosis-related genes and related drug prediction.J Thorac Dis. 2024 Sep 30;16(9):5860-5877. doi: 10.21037/jtd-24-569. Epub 2024 Sep 26. J Thorac Dis. 2024. PMID: 39444861 Free PMC article.
-
Role of CENPL, DARS2, and PAICS in determining the prognosis of patients with lung adenocarcinoma.Transl Lung Cancer Res. 2024 Oct 31;13(10):2729-2745. doi: 10.21037/tlcr-24-696. Epub 2024 Oct 28. Transl Lung Cancer Res. 2024. PMID: 39507047 Free PMC article.
-
Construction of a Prognostic Immune-Related LncRNA Risk Model for Lung Adenocarcinoma.Front Cell Dev Biol. 2021 Mar 18;9:648806. doi: 10.3389/fcell.2021.648806. eCollection 2021. Front Cell Dev Biol. 2021. PMID: 33869203 Free PMC article.
-
A new prognostic model for RHOV, ABCC2, and CYP4B1 to predict the prognosis and association with immune infiltration of lung adenocarcinoma.J Thorac Dis. 2023 Apr 28;15(4):1919-1934. doi: 10.21037/jtd-23-265. Epub 2023 Apr 10. J Thorac Dis. 2023. PMID: 37197482 Free PMC article.
Cited by
-
The mitotic spindle-related seven-gene predicts the prognosis and immune microenvironment of lung adenocarcinoma.J Cancer Res Clin Oncol. 2023 Sep;149(12):10131-10141. doi: 10.1007/s00432-023-04906-9. Epub 2023 Jun 2. J Cancer Res Clin Oncol. 2023. PMID: 37266661 Free PMC article.
References
LinkOut - more resources
Full Text Sources
Research Materials