

Single-Voxel Proton Magnetic Resonance Spectroscopy of the Thalamus in Idiopathic Epileptic Dogs and in Healthy Control Dogs
- PMID: 35873693
- PMCID: PMC9302964
- DOI: 10.3389/fvets.2022.885044
Single-Voxel Proton Magnetic Resonance Spectroscopy of the Thalamus in Idiopathic Epileptic Dogs and in Healthy Control Dogs
Abstract
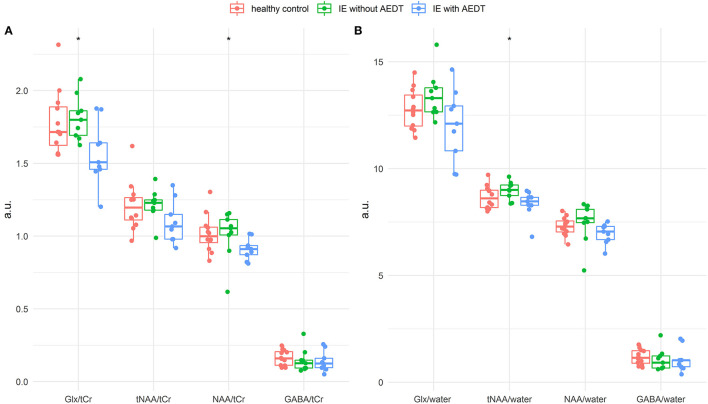
The role of magnetic resonance spectroscopy (MRS) in the investigation of brain metabolites in epileptic syndromes in dogs has not been explored systematically to date. The aim of this study was to investigate metabolites in the thalamus in dogs affected by idiopathic epilepsy (IE) with and without antiepileptic drug treatment (AEDT) and to compare them to unaffected controls. Our hypothesis is that similar to humans with generalized epilepsy and loss of consciousness, N-acetyl aspartate (NAA) would be reduced, and glutamate-glutamine (Glx) would be increased in treated and untreated IE in comparison with the control group. In this prospective case-control study, Border Collie (BC) and Greater Swiss Mountain dog (GSMD) were divided into three groups: (1) healthy controls, IE with generalized tonic-clonic seizures with (2) and without (3) AEDT. A total of 41 BC and GSMD were included using 3 Tesla single-voxel proton MRS of the thalamus (PRESS localization, shortest TE, TR = 2000 ms, NSA = 240). After exclusion of 11 dogs, 30 dogs (18 IE and 12 healthy controls) remained available for analysis. Metabolite concentrations were estimated with LCModel using creatine as reference and compared using Kruskal-Wallis and Wilcoxon rank-sum tests. The Kruskal-Wallis test revealed significant differences in the NAA-to-creatine (p = 0.04) and Glx-to-creatine (p = 0.03) ratios between the three groups. The Wilcoxon rank-sum test further showed significant reduction in the NAA/creatine ratio in idiopathic epileptic dogs under AEDT compared to epileptic dogs without AEDT (p = 0.03) and compared to healthy controls (p = 0.03). In opposite to humans, Glx/creatine ratio was significantly reduced in dogs with IE under AEDT compared to epileptic dogs without AEDT (p = 0.03) and controls (p = 0.02). IE without AEDT and healthy controls did not show significant difference, neither in NAA/creatine (p = 0.60), nor in Glx-to-creatine (p = 0.55) ratio. In conclusion, MRS showed changes in dogs with IE and generalized seizures under AEDT, but not in those without AEDT. Based upon these results, MRS can be considered a useful advanced imaging technique for the evaluation of dogs with IE in the clinical and research settings.
Keywords: MRS—1H nuclear magnetic resonance spectra; N-acetyl aspartate (NAA); canine; generalized seizures; glutamate (Glu); glutamate-glutamine (Glx); glutamine (Gln).
Copyright © 2022 Mauri, Richter, Steffen, Zölch and Beckmann.
Conflict of interest statement
NM was employed by Vetimage Diagnostik GmbH. The remaining authors declare that the research was conducted in the absence of any commercial or financial relationships that could be construed as a potential conflict of interest.
Figures
Similar articles
-
Ketamine administration in idiopathic epileptic and healthy control dogs: Can we detect differences in brain metabolite response with spectroscopy?Front Vet Sci. 2023 Jan 6;9:1093267. doi: 10.3389/fvets.2022.1093267. eCollection 2022. Front Vet Sci. 2023. PMID: 36686158 Free PMC article.
-
Interictal Single-Voxel Proton Magnetic Resonance Spectroscopy of the Temporal Lobe in Dogs With Idiopathic Epilepsy.Front Vet Sci. 2020 Sep 24;7:644. doi: 10.3389/fvets.2020.00644. eCollection 2020. Front Vet Sci. 2020. PMID: 33195502 Free PMC article.
-
Increased glutamate + glutamine levels in the thalamus of patients with essential tremor: A preliminary proton MR spectroscopic study.Parkinsonism Relat Disord. 2018 Feb;47:57-63. doi: 10.1016/j.parkreldis.2017.11.345. Epub 2017 Nov 28. Parkinsonism Relat Disord. 2018. PMID: 29203059
-
Evaluation of intracranial neoplasia and noninfectious meningoencephalitis in dogs by use of short echo time, single voxel proton magnetic resonance spectroscopy at 3.0 Tesla.Am J Vet Res. 2016 May;77(5):452-62. doi: 10.2460/ajvr.77.5.452. Am J Vet Res. 2016. PMID: 27111012
-
1H-MRS reveals metabolic alterations in generalized tonic-clonic seizures before and after treatment.Acta Neurol Scand. 2022 Feb;145(2):200-207. doi: 10.1111/ane.13534. Epub 2021 Sep 30. Acta Neurol Scand. 2022. PMID: 34595746
Cited by
-
Magnetic resonance imaging in canine idiopathic epilepsy: a mini-review.Front Vet Sci. 2024 Jul 3;11:1427403. doi: 10.3389/fvets.2024.1427403. eCollection 2024. Front Vet Sci. 2024. PMID: 39021411 Free PMC article. Review.
-
Ketamine administration in idiopathic epileptic and healthy control dogs: Can we detect differences in brain metabolite response with spectroscopy?Front Vet Sci. 2023 Jan 6;9:1093267. doi: 10.3389/fvets.2022.1093267. eCollection 2022. Front Vet Sci. 2023. PMID: 36686158 Free PMC article.
-
Diffusion tensor-based analysis of white matter in dogs with idiopathic epilepsy.Front Vet Sci. 2023 Dec 18;10:1325521. doi: 10.3389/fvets.2023.1325521. eCollection 2023. Front Vet Sci. 2023. PMID: 38192722 Free PMC article.
-
Correlation between semiautomated magnetic resonance imaging volumetry of the cingulate gyrus and interictal epileptiform discharge lateralization in dogs with idiopathic epilepsy.J Vet Intern Med. 2024 Sep-Oct;38(5):2590-2602. doi: 10.1111/jvim.17178. Epub 2024 Aug 27. J Vet Intern Med. 2024. PMID: 39189832 Free PMC article.
References
LinkOut - more resources
Full Text Sources