Monitoring Turbidity in San Francisco Estuary and Sacramento-San Joaquin Delta Using Satellite Remote Sensing
- PMID: 35873730
- PMCID: PMC9290138
- DOI: 10.1111/1752-1688.12917
Monitoring Turbidity in San Francisco Estuary and Sacramento-San Joaquin Delta Using Satellite Remote Sensing
Abstract
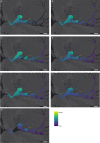
This study utilizes satellite data to investigate water quality conditions in the San Francisco Estuary and its upstream delta, the Sacramento-San Joaquin River Delta. To do this, this study derives turbidity from the European Space Agency satellite Sentinel-2 acquired from September 2015 to June 2019 and conducts a rigorous validation with in situ measurements of turbidity from optical sensors at continuous monitoring stations. This validation includes 965 matchup comparisons between satellite and in situ sensor data across 22 stations, yielding R 2 = 0.63 and 0.75 for Nephelometric Turbidity Unit and Formazin Nephelometric Unit (FNU) stations, respectively. This study then applies remote sensing to evaluate patterns in turbidity during the Suisun Marsh Salinity Control Gates Action ("Gates action"), a pilot study designed to increase habitat access and quality for the endangered Delta Smelt. The basic strategy was to direct more freshwater into Suisun Marsh, creating more low salinity habitat that would then have higher (and more suitable) turbidity than upstream river channels. For all seven acquisitions considered from June 29 to September 27, 2018, turbidity conditions in Bays and Sloughs subregions were consistently higher (and more suitable) (26-47 FNU) than what was observed in the upstream River region (13-25 FNU). This overall pattern was observed when comparing images acquired during similar tidal stages and heights.
Keywords: Delta Smelt; San Francisco Estuary; Suisun Marsh; remote sensing; turbidity; water quality.
© 2021 Jet Propulsion Laboratoty. Journal of the American Water Resources Association published by Wiley Periodicals LLC on behalf of American Water Resources Association.
Figures


References
-
- Bailey, S.W. , and Werdell P.J.. 2006. “A Multi‐Sensor Approach for the on‐Orbit Validation of Ocean Color Satellite Data Products.” Remote Sensing of Environment 102: 12–23.
-
- Bever, A.J. , MacWilliams M.L., and Fullerton D.K.. 2018. “Influence of an Observed Decadal Decline in Wind Speed on Turbidity in the San Francisco Estuary.” Estuaries and Coasts 41: 1943–67.
-
- Brooks, M.L. , Fleishman E., Brown L.R., Lehman P.W., Werner I., Scholz N., Mitchelmore C. et al. 2012. “Life Histories, Salinity Zones, and Sublethal Contributions of Contaminants to Pelagic Fish Declines Illustrated with a Case Study of San Francisco Estuary, California, USA.” Estuaries and Coasts 35: 603–21.
-
- Brown, L.R. , Bennett W.A., Wagner R.W., Morgan‐King T., Knowles N., Feyrer F., Schoellhamer D.H., Stacey M.T., and Dettinger M.. 2013. “Implications for Future Survival of Delta Smelt from Four Climate Change Scenarios for the Sacramento–San Joaquin Delta, California.” Estuaries and Coasts 36: 754–74.
-
- Caballero, I. , Navarro G., and Ruiz J.. 2018. “Multi‐Platform Assessment of Turbidity Plumes during Dredging Operations in a Major Estuarine System.” International Journal of Applied Earth Observation and Geoinformation 68: 31–41.
