

Heterogeneity of resting-state EEG features in juvenile myoclonic epilepsy and controls
- PMID: 35873918
- PMCID: PMC9301584
- DOI: 10.1093/braincomms/fcac180
Heterogeneity of resting-state EEG features in juvenile myoclonic epilepsy and controls
Abstract
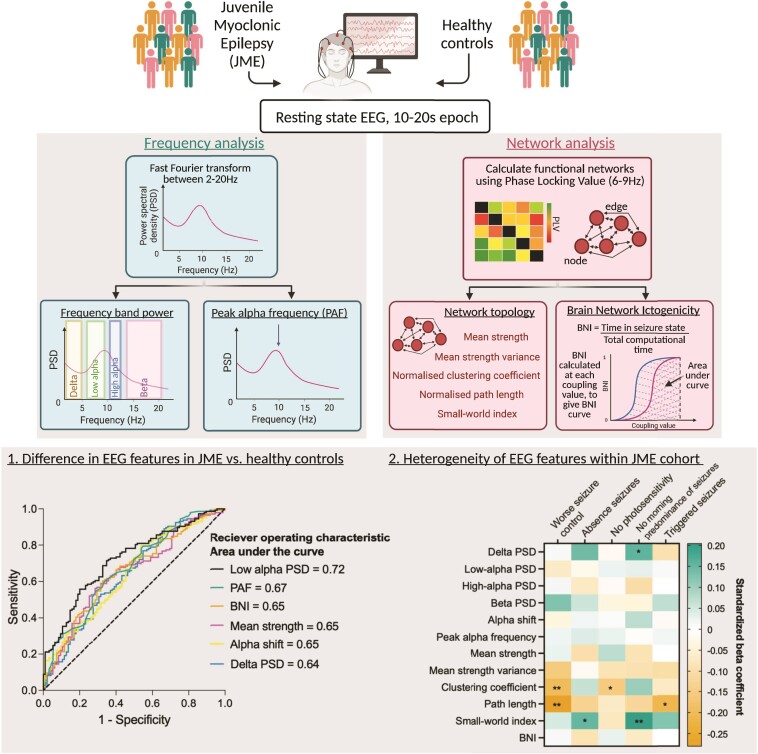
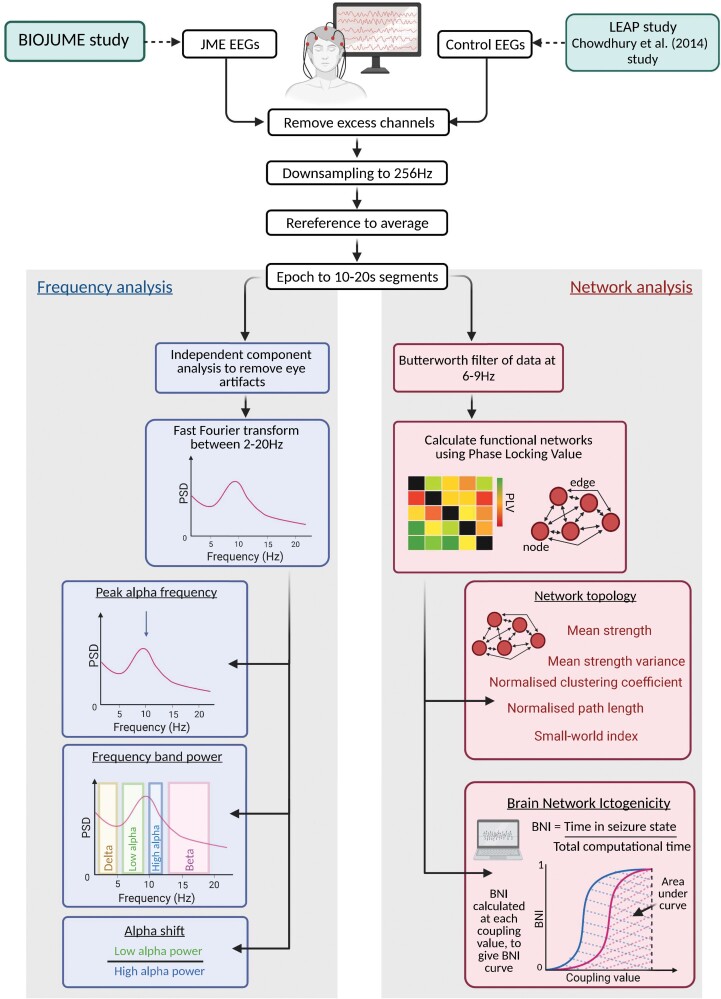
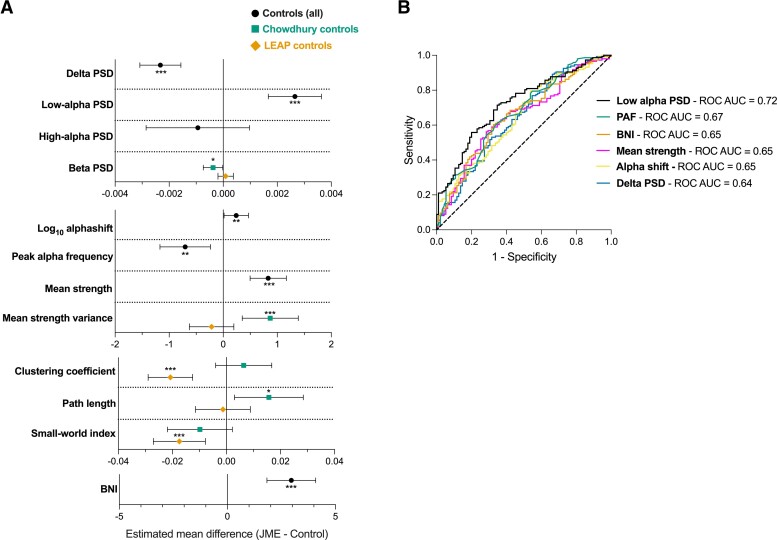
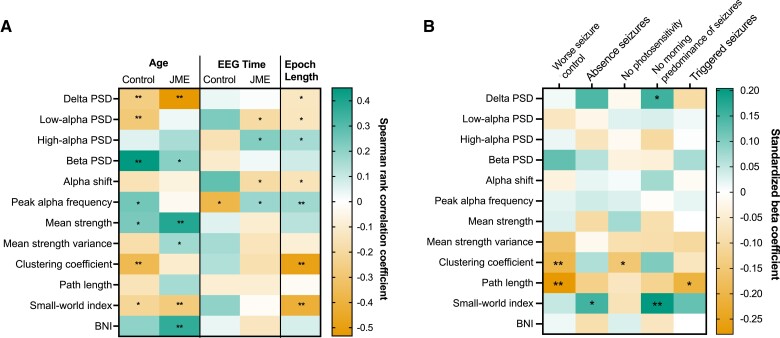
Abnormal EEG features are a hallmark of epilepsy, and abnormal frequency and network features are apparent in EEGs from people with idiopathic generalized epilepsy in both ictal and interictal states. Here, we characterize differences in the resting-state EEG of individuals with juvenile myoclonic epilepsy and assess factors influencing the heterogeneity of EEG features. We collected EEG data from 147 participants with juvenile myoclonic epilepsy through the Biology of Juvenile Myoclonic Epilepsy study. Ninety-five control EEGs were acquired from two independent studies [Chowdhury et al. (2014) and EU-AIMS Longitudinal European Autism Project]. We extracted frequency and functional network-based features from 10 to 20 s epochs of resting-state EEG, including relative power spectral density, peak alpha frequency, network topology measures and brain network ictogenicity: a computational measure of the propensity of networks to generate seizure dynamics. We tested for differences between epilepsy and control EEGs using univariate, multivariable and receiver operating curve analysis. In addition, we explored the heterogeneity of EEG features within and between cohorts by testing for associations with potentially influential factors such as age, sex, epoch length and time, as well as testing for associations with clinical phenotypes including anti-seizure medication, and seizure characteristics in the epilepsy cohort. P-values were corrected for multiple comparisons. Univariate analysis showed significant differences in power spectral density in delta (2-5 Hz) (P = 0.0007, hedges' g = 0.55) and low-alpha (6-9 Hz) (P = 2.9 × 10⁻⁸, g = 0.80) frequency bands, peak alpha frequency (P = 0.000007, g = 0.66), functional network mean degree (P = 0.0006, g = 0.48) and brain network ictogenicity (P = 0.00006, g = 0.56) between epilepsy and controls. Since age (P = 0.009) and epoch length (P = 1.7 × 10⁻⁸) differed between the two groups and were potential confounders, we controlled for these covariates in multivariable analysis where disparities in EEG features between epilepsy and controls remained. Receiver operating curve analysis showed low-alpha power spectral density was optimal at distinguishing epilepsy from controls, with an area under the curve of 0.72. Lower average normalized clustering coefficient and shorter average normalized path length were associated with poorer seizure control in epilepsy patients. To conclude, individuals with juvenile myoclonic epilepsy have increased power of neural oscillatory activity at low-alpha frequencies, and increased brain network ictogenicity compared with controls, supporting evidence from studies in other epilepsies with considerable external validity. In addition, the impact of confounders on different frequency-based and network-based EEG features observed in this study highlights the need for careful consideration and control of these factors in future EEG research in idiopathic generalized epilepsy particularly for their use as biomarkers.
Keywords: EEG; biomarkers; epilepsy; heterogeneity; networks.
© The Author(s) 2022. Published by Oxford University Press on behalf of the Guarantors of Brain.
Figures
References
-
- International League Against Epilepsy . Juvenile myoclonic epilepsy. Accessed 4 June 2021. https://www.epilepsydiagnosis.org/syndrome/jme-eeg.html
-
- Gibbs FA, Gibbs EL, Lennox WG. Electroencephalographic classification of epileptic patients and control subjects. Arch Neurol Psychiatry. 1943;50(2):111–128. doi: 10.1001/archneurpsyc.1943.02290200011001 - DOI
Grants and funding
LinkOut - more resources
Full Text Sources