. 2022 Jul 7:13:916231.
doi: 10.3389/fpls.2022.916231. eCollection 2022.

Rose Rosette Disease Resistance Loci Detected in Two Interconnected Tetraploid Garden Rose Populations

Affiliations

Rose Rosette Disease Resistance Loci Detected in Two Interconnected Tetraploid Garden Rose Populations

Jeekin Lau et al. Front Plant Sci. .

Abstract

Rose rosette disease (RRD), caused by the Rose rosette emaravirus (RRV), is a major threat to the garden rose industry in the United States. There has been limited work on the genetics of host plant resistance to RRV. Two interconnected tetraploid garden rose F1 biparental mapping populations were created to develop high-quality tetraploid rose linkage maps that allowed the discovery of RRD resistance quantitative trait loci (QTLs) on linkage groups (LGs) 5, 6, and 7. These QTLs individually accounted for around 18-40% of the phenotypic variance. The locus with the greatest effect on partial resistance was found in LG 5. Most individuals with the LG 5 QTL were in the simplex configuration; however, two individuals were duplex (likely due to double reduction). Identification of resistant individuals and regions of interest can help the development of diagnostic markers for marker-assisted selection in a breeding program.

Keywords: Phyllocoptes fructiphilus; Rosa; Rose rosette emaravirus; emaravirus; eriophyid mite; quantitative trait loci; rose rosette virus.


Conflict of interest statement

The authors declare that the research was conducted in the absence of any commercial or financial relationships that could be construed as a potential conflict of interest.

Figures

FIGURE 1
FIGURE 1
Half violin plots of the raw rose rosette disease (RRD) severity ratings over 3 years separated by the two families. Least-squared means were compared via a t-test. The panes of the violin plots are (A) RRD severity distribution of over all 3 years (2019 to 2021), (B) RRD severity distribution in 2019, (C) RRD severity distribution in 2020, (D) RRD severity distribution in September 2021, and (E) RRD severity distribution in November 2021.
FIGURE 2
FIGURE 2
Linkage maps of two tetraploid garden rose mapping populations, Stormy Weather × Brite Eyes (SWxBE) and Brite Eyes by My Girl (BExMG) aligned to the Rosa chinensis reference genome (Hibrand-Saint Oyant et al., 2018). The genomic physical positions are plotted on the y-axis, and the genetic position (cM) is plotted on the x-axis.
FIGURE 3
FIGURE 3
Quantitative trait locus (QTL) scans of (A,B) rose rosette disease (RRD) severity and (C,D) Rose rosette emaravirus (RRV) RT-qPCR detection using Ct values on two biparental tetraploid garden rose mapping populations. 95% confidence intervals are shaded while the QTL peak is represented by a triangle.
FIGURE 4
FIGURE 4
Quantitative trait locus allele effect estimates from QTLpoly on rose rosette disease severity and Rose rosette emaravirus RT-qPCR from two biparental tetraploid garden rose mapping populations. Bar plots indicate the direction of the QTL’s effect. (A–C) Allele effect plots of RRD severity for QTL on LGs 5 and 6, and for the RRV detection measured using RT-qPCR on LG 5 in the SWxBE population. (D–F) Allele effect plots of RRD severity for QTL on LGs 5 and 7, and for the RRV detection measured using RT-qPCR on LG 5 in the BExMG population.
FIGURE 5
FIGURE 5
An example of homolog probabilities for each parental homolog for one individual, 16009-N090, of a tetraploid biparental mapping population on LG 5. On the y-axis is the probability that the individual carries the parental homolog. On the x-axis is the map position in centimorgan. In the case of this individual, the h-homolog at 35.08 cM carries the resistant allele for qRRD.SWxBE-ch5, and this is an individual that carries the resistant allele.
FIGURE 6
FIGURE 6
Quantitative trait locus scans from two tetraploid garden rose interconnected populations for (A) rose rosette disease (RRD) severity and (B) Ct values from R-software package diaQTL. On the x-axis is the genome position and on the y-axis is the relative strength of the QTL measured –ΔDIC, the test statistic used in detecting QTL in diaQTL. The peaks observed in the –ΔDIC profile are similar to other test statistics used to plot QTL profiles. The gold-colored line and red-colored line are alpha = 0.05 and 0.10 genome-wide significance, respectively.
FIGURE 7
FIGURE 7
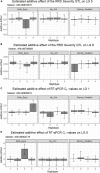
Estimated additive allele effects for (A,B) RRD severity and (C,D) RT-qPCR for RRV in two interconnected tetraploid garden rose mapping populations estimated from the R-software diaQTL. On the x-axis are the parental homologs, and the y-axis is the estimated additive effect of the parental homolog at the QTL position on the phenotype. For example: (A) the presence of the 3rd homolog in an individual has an estimated negative effect on the RRD severity observed.
FIGURE 8
FIGURE 8
Means separation and 0.95 confidence intervals of RRD severity best linear unbiased estimates (BLUEs) measured in two tetraploid biparental garden rose mapping populations grouped by QTL carried by progeny. Groups with the same letters are not significantly different from each other using Tukey’s test (α = 0.05). Individuals shown in this study are from r-packages MAPpoly and QTLpoly (note: the sample numbers depicted in this study represent only the individuals that were phenotyped).

References

    1. Allington W. B., Staples R., Viehmeyer G. (1968). Transmission of Rose Rosette Virus by the Eriophyid Mite Phyllocoptes fructiphilus. J. Econ. Entomol. 61 1137–1140. 10.1093/jee/61.5.1137 - DOI
    1. Amadeu R. R., Muñoz P. R., Zheng C., Endelman J. B. (2021). QTL mapping in outbred tetraploid (and diploid) diallel populations. Genetics 219:iyab124. 10.1093/genetics/iyab124 - DOI - PMC - PubMed
    1. Amrine J. W., Jr., Hindal D. F., Stasny T. A., Williams R. L., Coffman C. C. (1988). Transmission of the rose rosette disease agent to Rosa multiflora by Phyllocoptes fructiphilus (Acari: Eriophyidae). Entomol. News U.S.A. 99 239-252.
    1. Amrine J. W. (1996). “4.1.2 Phyllocoptes fructiphilus and biological control of multiflora rose,” in World Crop Pests Eriophyoid Mites Their Biology, Natural Enemies and Control, eds Lindquist E. E., Sabelis M. W., Bruin J. (Amsterdam: Elsevier; ), 741–749. 10.1016/S1572-4379(96)80050-9 - DOI
    1. Bourke P., Geest G., van, Voorrips R. E., Jansen J., Kranenburg T., et al. (2017a). polymapR: linkage analysis and genetic map construction from F1 populations of outcrossing polyploids. bioRxiv. [preprint]. 10.1101/228817 - DOI - PMC - PubMed

LinkOut - more resources