Invasive Plants and Species Richness Impact Litter Decomposition in Riparian Zones
- PMID: 35873999
- PMCID: PMC9301390
- DOI: 10.3389/fpls.2022.955656
Invasive Plants and Species Richness Impact Litter Decomposition in Riparian Zones
Abstract
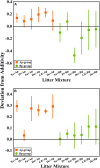
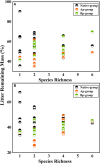
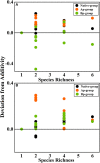
Natural ecosystems generally include litter decomposition as part of the natural cycle since the material properties and the environment greatly influence the decomposition rate. The invasion of exotic plants alters the species diversity and growth characteristics of plant communities, but its impact on litter decomposition is unknown in the riparian zone. This study examines how invasive plants affect the early stages of litter decomposition and how species richness impacts them. This experiment involved a random litter mixture of exotic (Alternanthera philoxeroides and Bidens pilosa) and native species in the riparian zone of the Three Gorges Dam Reservoir in China. There were 43 species mixture types, with various species richness ranging from 1 to 6. Litterbags were placed in the hydro-fluctuation zone and terrestrial zone, where they decomposed over the course of 55 days. Invasive plants decompose rapidly compared to native plants (35.71% of the remaining mass of the invasive plant). The invasive plant A. philoxeroides has the potential to accelerate native plant decomposition (0.29 of non-added synergetic effect), but Bidens pilosa cannot. Nonetheless, species richness had little effect on the decomposition rate. These effects are dependent upon differences in chemical functional characteristics among the species. The initial traits of the plants, specifically C, N, and C/N, were significantly and linearly correlated with the loss of mixed litter mass and mixing effect strength (P < 0.01). In addition, submergence decomposition conditions reduce the disturbance of invasive plants and predict decomposition rates based on litter characteristics. Invasive plants can therefore impact the material cycle of an ecosystem. There is a need to examine decomposition time, which may also involve considering other factors.
Keywords: Three Gorges Reservoir; exotic plants; hydro-fluctuation zone; plant traits; species diversity; submergence environment.
Copyright © 2022 Hu, Arif, Ding, Li, He and Li.
Conflict of interest statement
The authors declare that the research was conducted in the absence of any commercial or financial relationships that could be construed as a potential conflict of interest.
Figures


Similar articles
-
Non-native plant litter enhances soil carbon dioxide emissions in an invaded annual grassland.PLoS One. 2014 Mar 19;9(3):e92301. doi: 10.1371/journal.pone.0092301. eCollection 2014. PLoS One. 2014. PMID: 24647312 Free PMC article.
-
Non-Additive effects on decomposition from mixing litter of the invasive Mikania micrantha H.B.K. with native plants.PLoS One. 2013 Jun 20;8(6):e66289. doi: 10.1371/journal.pone.0066289. Print 2013. PLoS One. 2013. PMID: 23840435 Free PMC article.
-
Response of Annual Herbaceous Plant Leaching and Decomposition to Periodic Submergence in Mega-Reservoirs: Changes in Litter Nutrients and Soil Properties for Restoration.Biology (Basel). 2021 Nov 5;10(11):1141. doi: 10.3390/biology10111141. Biology (Basel). 2021. PMID: 34827134 Free PMC article.
-
Plant soaking decomposition as well as nitrogen and phosphorous release in the water-level fluctuation zone of the Three Gorges Reservoir.Sci Total Environ. 2017 Aug 15;592:527-534. doi: 10.1016/j.scitotenv.2017.03.104. Epub 2017 Mar 18. Sci Total Environ. 2017. PMID: 28325595
-
Drowned, buried and carried away: effects of plant traits on the distribution of native and alien species in riparian ecosystems.New Phytol. 2014 Oct;204(1):19-36. doi: 10.1111/nph.12951. Epub 2014 Jul 30. New Phytol. 2014. PMID: 25130059 Review.
Cited by
-
The Invasive Tradescantia zebrina Affects Litter Decomposition, but It Does Not Change the Lignocellulolytic Fungal Community in the Atlantic Forest, Brazil.Plants (Basel). 2023 May 30;12(11):2162. doi: 10.3390/plants12112162. Plants (Basel). 2023. PMID: 37299140 Free PMC article.
-
Exploring main soil drivers of vegetation succession in abandoned croplands of Minqin Oasis, China.PeerJ. 2024 Jul 5;12:e17627. doi: 10.7717/peerj.17627. eCollection 2024. PeerJ. 2024. PMID: 38978753 Free PMC article.
-
Distinguishing the mechanisms driving multifaceted plant diversity in subtropical reservoir riparian zones.Front Plant Sci. 2023 Feb 24;14:1138368. doi: 10.3389/fpls.2023.1138368. eCollection 2023. Front Plant Sci. 2023. PMID: 36909398 Free PMC article.
-
Plant-soil interactions and C:N:P stoichiometric homeostasis of plant organs in riparian plantation.Front Plant Sci. 2022 Aug 1;13:979023. doi: 10.3389/fpls.2022.979023. eCollection 2022. Front Plant Sci. 2022. PMID: 35979078 Free PMC article.
-
Exotic mangrove Laguncularia racemosa litter input accelerates nutrient cycling in mangrove ecosystems.Front Plant Sci. 2024 Oct 8;15:1463548. doi: 10.3389/fpls.2024.1463548. eCollection 2024. Front Plant Sci. 2024. PMID: 39439519 Free PMC article.
References
-
- Arif M., Jie Z., Tahir M., Xin H., Changxiao L. (2022b). The impact of stress factors on riparian zone degradation around dams and reservoirs. Land Degrad. Dev. 4310, 1–15. 10.1002/ldr.4310 - DOI
-
- Ashton I. W., Hyatt L. A., Howe K. M., Gurevitch J., Lerdau M. T. (2005). Invasive species accelerate decomposition and litter nitrogen loss in a mixed deciduous forest. Ecol. Appl. 15, 1263–1272. 10.1890/04-0741 - DOI
LinkOut - more resources
Full Text Sources

