. 2022 Jul;9(3):032203.
doi: 10.1117/1.NPh.9.3.032203. Epub 2022 Jul 20.

Implantable acousto-optic window for monitoring ultrasound-mediated neuromodulation in vivo

Affiliations

Implantable acousto-optic window for monitoring ultrasound-mediated neuromodulation in vivo

Sungho Lee et al. Neurophotonics. 2022 Jul.

Abstract

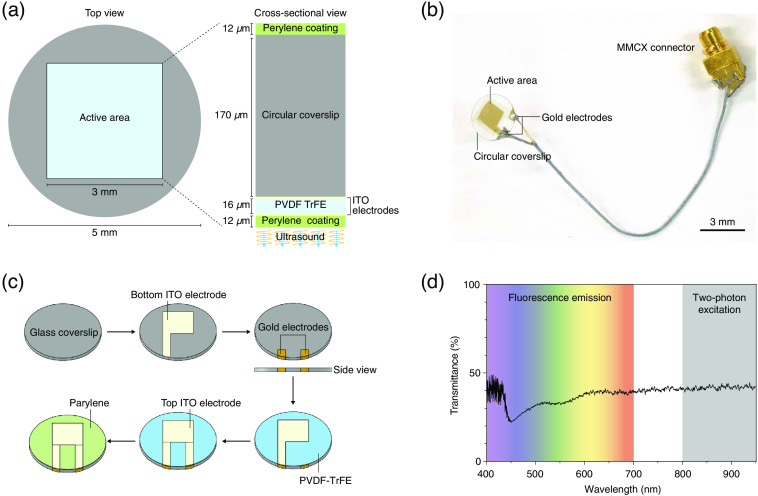
Significance: Ultrasound has recently received considerable attention in neuroscience because it provides noninvasive control of deep brain activity. Although the feasibility of ultrasound stimulation has been reported in preclinical and clinical settings, its mechanistic understanding remains limited. While optical microscopy has become the "gold standard" tool for investigating population-level neural functions in vivo, its application for ultrasound neuromodulation has been technically challenging, as most conventional ultrasonic transducers are not designed to be compatible with optical microscopy. Aim: We aimed to develop a transparent acoustic transducer based on a glass coverslip called the acousto-optic window (AOW), which simultaneously provides ultrasound neuromodulation and microscopic monitoring of neural responses in vivo. Approach: The AOW was fabricated by the serial deposition of transparent acoustic stacks on a circular glass coverslip, comprising a piezoelectric material, polyvinylidene fluoride-trifluoroethylene, and indium-tin-oxide electrodes. The fabricated AOW was implanted into a transgenic neural-activity reporter mouse after open craniotomy. Two-photon microscopy was used to observe neuronal activity in response to ultrasonic stimulation through the AOW. Results: The AOW allowed microscopic imaging of calcium activity in cortical neurons in response to ultrasound stimulation. The optical transparency was 40 % over the visible and near-infrared spectra, and the ultrasonic pressure was 0.035 MPa at 10 MHz corresponding to 10 mW / cm 2 . In anesthetized Gad2-GCaMP6-tdTomato mice, we observed robust ultrasound-evoked activation of inhibitory cortical neurons at depths up to 200 μ m . Conclusions: The AOW is an implantable ultrasonic transducer that is broadly compatible with optical imaging modalities. The AOW will facilitate our understanding of ultrasound neuromodulation in vivo.

Keywords: in vivo two-photon; neuromodulation; ultrasound.


Figures

Fig. 1
Fig. 1
The AOW. (a) Schematic layout of the AOW. The AOW is fabricated on a circular glass coverslip with a diameter of 5 mm. The squared active area contains a piezoelectric material (PVDF-TrFE) and ITO electrodes for ultrasound generation. (b) Photograph of the fabricated AOW. (c) A step-by-step process for fabricating AOW. (d) Optical transmittance of the AOW active area. The visible spectral region (400 to 700 nm) was used for collecting fluorescence emission. The near-infrared spectral region (800 to 1000 nm) was used for two-photon excitation of a femtosecond laser.
Fig. 2
Fig. 2
Acoustic characterization of the AOW. (a) The left panel displays the simulated pulse-echo impulse response result in the time and frequency domains in the 170-μm-thick glass coverslip. The right panel displays the measured pulse-echo impulse response result. (b) Measured impedance graph of the AOW. (c) Measured ultrasound beam profiles and pressure line plots in lateral (XY) and axial (XZ) views. Simulated pressure line plot in axial view (XZ) was visualized with a red solid line positioned 100  μm from the surface. The scale bar in XY and XZ is 1 mm. (d) Simulated ultrasound beam profile and averaged pressure in regions A and B in the lateral view with a 2-mm depth and 0.1-mm depth from the surface of AOW. Scale bar, 1 mm.
Fig. 3
Fig. 3
AOW-based cranial window model. (a) Schematic illustration of the overall setup. The AOW is implanted after open craniotomy and connected to the printed circuit board (PCB) driver board fed by a function generator and a DC power supply. The PCB driver board amplifies the input trigger signal by approximately twofold. (b) A schematic illustration of the ultrasound parameter used in the experiment. Frequency, PRF, duty cycle, and pulse length are 10 MHz, 1.5 kHz, 50%, and 1 to 20 s, respectively. (c) Illurstration presenting the structural configurations of AOW-based cranial window implant in vivo (left), and a bright field image of the cortical surface visualized through the implanted AOW transducer (right). Note that the scale bars in the left and right figures indicate 10 and 0.5 mm, respectively. (d) A representative z-stacked images of cortical blood vessels up to 200  μm from the pia. Scale bar, 40  μm.
Fig. 4
Fig. 4
Microscopic observation of ultrasound-mediated neuromodulation using the AOW-based cranial window model. (a) A representative two-photon fluorescence image on the somatosensory cortex of a Gad2-GCaMP6-tdTomato mouse (left) and a pseudocolored image of the change in GCaMP6 fluorescence (ΔF) by the ultrasound stimulation (right). Scale bars, 15  μm. (b) GCaMP6-based neuronal Ca2+ traces represented as ΔF/F (n=25 neurons). Ultrasound stimulation was exerted through the AOW during the blue shaded region (input voltage: 20 V). (c) The integrated neuronal activation in response to varying stimulation periods from 1 to 20 s (n=34, 17, 84, and 48 neurons for 1, 5, 10, and 20 s, respectively; green dot: mean, whisker: SEM, acquired from three mice). The dotted curve is fitted to the sigmoidal curve (R2=0.11). ***, p<0.0001 (one-way ANOVA). (d) Average Ca2+ signal time course of PV neurons in response to varying stimulation periods in (c) (green line: mean, gray shade: SEM, acquired from three mice).

Similar articles

Cited by

References

    1. Lee J., et al. , “Transcranial magnetic stimulation parameters as neurophysiological biomarkers in Alzheimer’s disease,” Ann. Clin. Neurophysiol. 23, 7–16 (2021).10.14253/acn.2021.23.1.7 - DOI
    1. Lozano A. M., et al. , “Deep brain stimulation: current challenges and future directions,” Nat. Rev. Neurol. 15, 148–160 (2019).10.1038/s41582-018-0128-2 - DOI - PMC - PubMed
    1. Gardner J., “A history of deep brain stimulation: technological innovation and the role of clinical assessment tools,” Soc. Stud. Sci. 43, 707–728 (2013).10.1177/0306312713483678 - DOI
    1. Nitsche M. A., et al. , “Transcranial direct current stimulation: state of the art 2008,” Brain Stimul. 1, 206–223 (2008).10.1016/j.brs.2008.06.004 - DOI - PubMed
    1. Brunoni A. R., et al. , “Clinical research with transcranial direct current stimulation (tDCS): challenges and future directions,” Brain Stimul. 5, 175–195 (2012).10.1016/j.brs.2011.03.002 - DOI - PMC - PubMed