

Inter-Trial Formant Variability in Speech Production Is Actively Controlled but Does Not Affect Subsequent Adaptation to a Predictable Formant Perturbation
- PMID: 35874163
- PMCID: PMC9300893
- DOI: 10.3389/fnhum.2022.890065
Inter-Trial Formant Variability in Speech Production Is Actively Controlled but Does Not Affect Subsequent Adaptation to a Predictable Formant Perturbation
Abstract
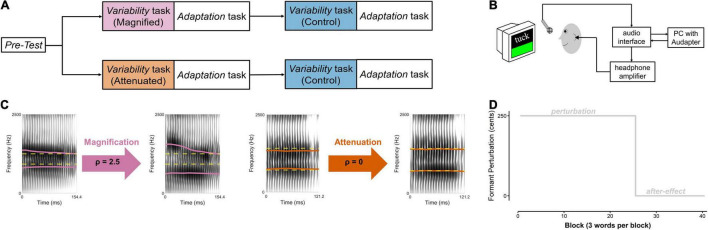
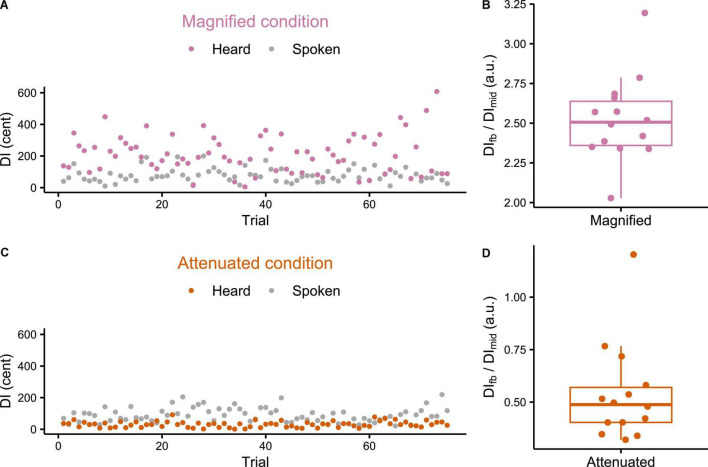
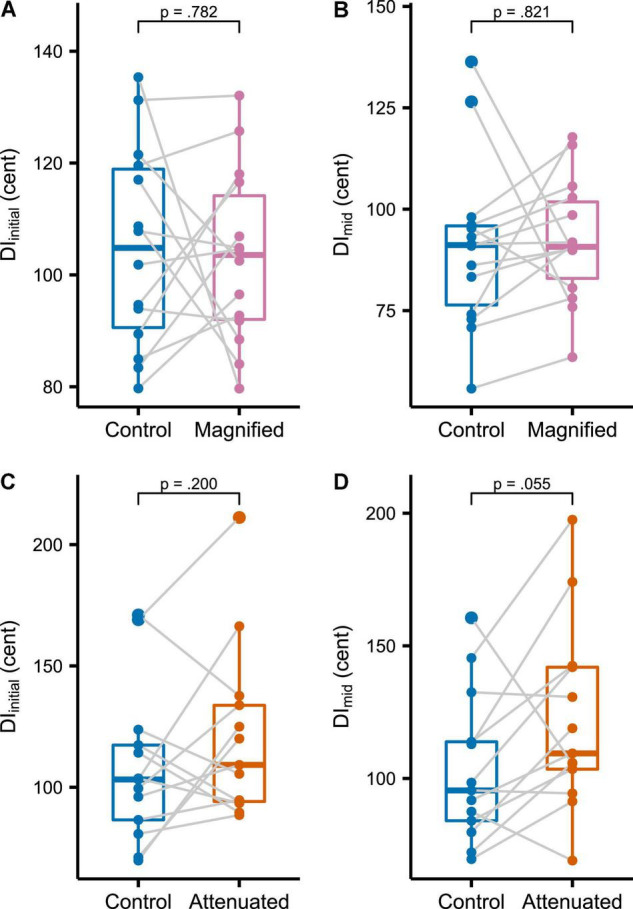
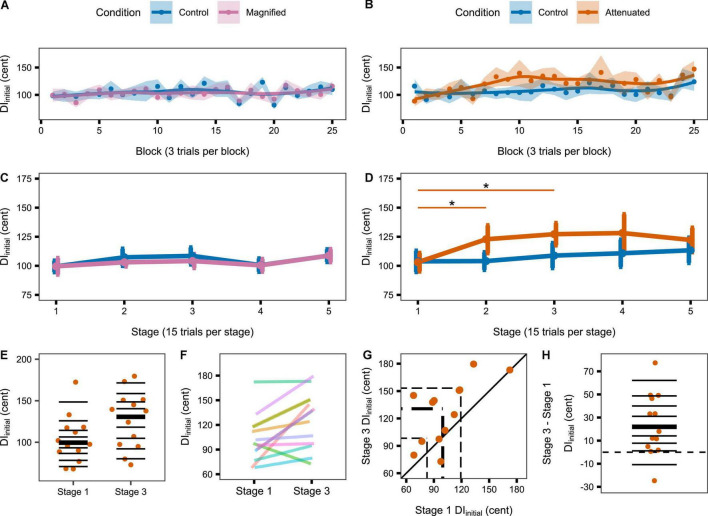
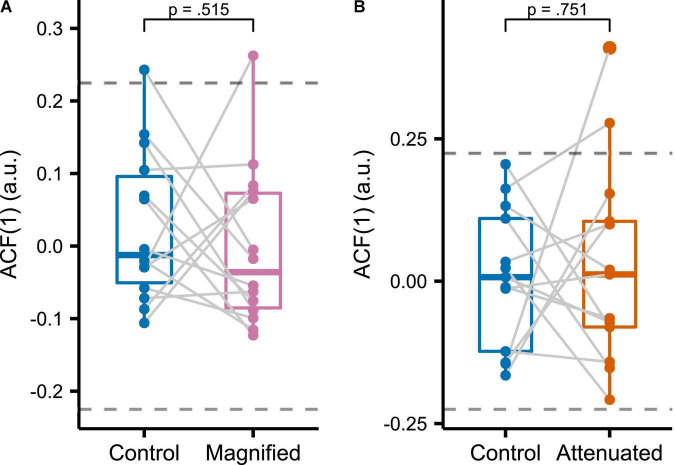
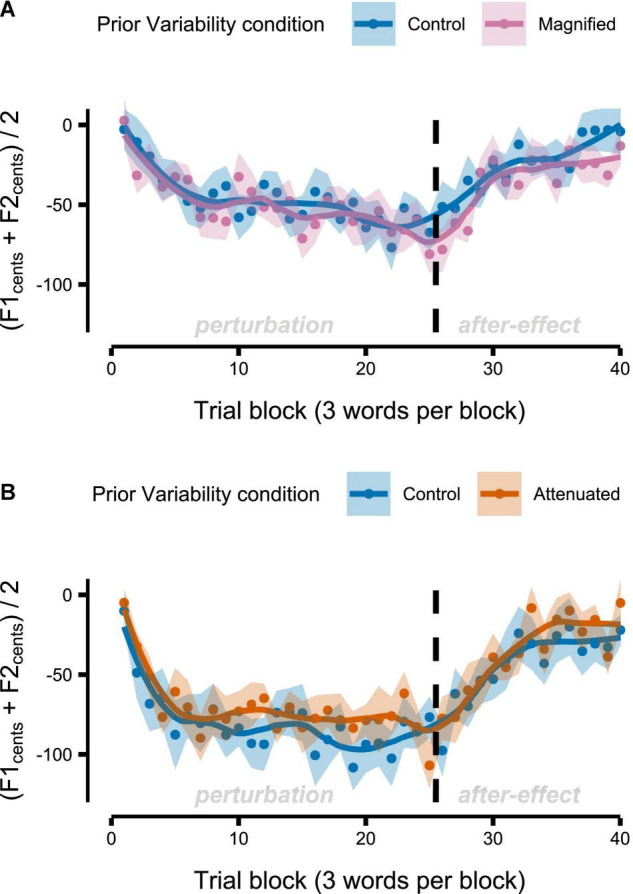
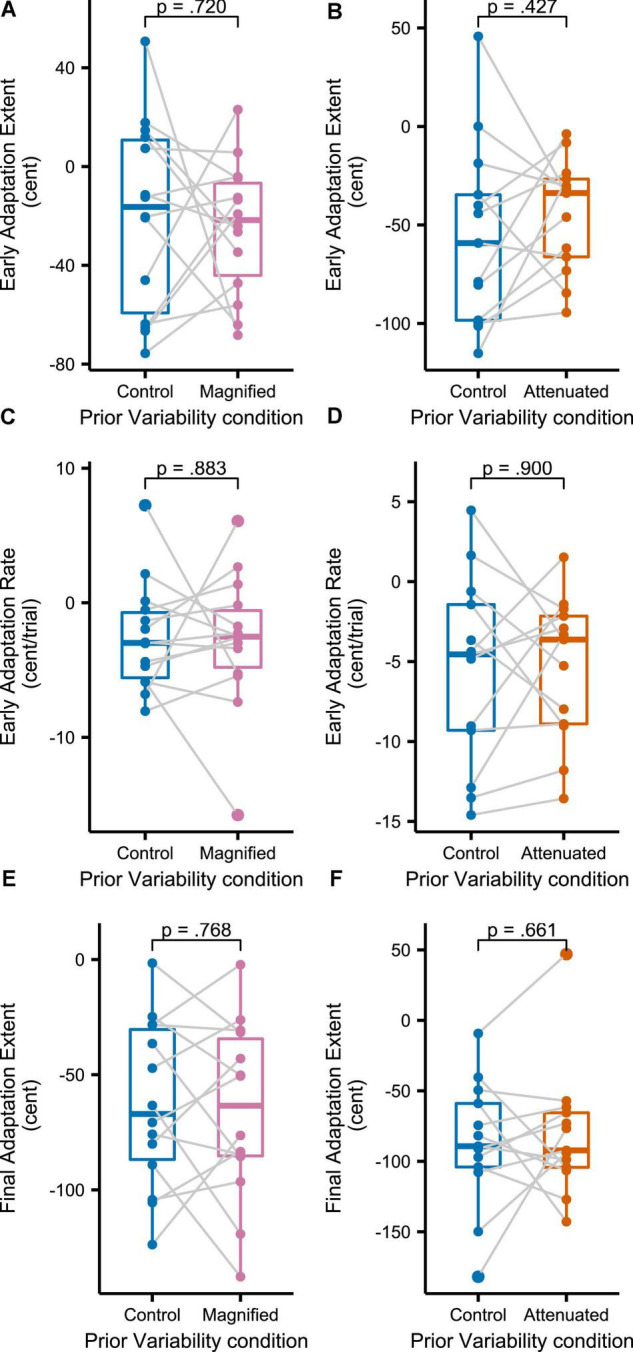
Despite ample evidence that speech production is associated with extensive trial-to-trial variability, it remains unclear whether this variability represents merely unwanted system noise or an actively regulated mechanism that is fundamental for maintaining and adapting accurate speech movements. Recent work on upper limb movements suggest that inter-trial variability may be not only actively regulated based on sensory feedback, but also provide a type of workspace exploration that facilitates sensorimotor learning. We therefore investigated whether experimentally reducing or magnifying inter-trial formant variability in the real-time auditory feedback during speech production (a) leads to adjustments in formant production variability that compensate for the manipulation, (b) changes the temporal structure of formant adjustments across productions, and (c) enhances learning in a subsequent adaptation task in which a predictable formant-shift perturbation is applied to the feedback signal. Results show that subjects gradually increased formant variability in their productions when hearing auditory feedback with reduced variability, but subsequent formant-shift adaptation was not affected by either reducing or magnifying the perceived variability. Thus, findings provide evidence for speakers' active control of inter-trial formant variability based on auditory feedback from previous trials, but-at least for the current short-term experimental manipulation of feedback variability-not for a role of this variability regulation mechanism in subsequent auditory-motor learning.
Keywords: acoustics; adaptation; articulation; auditory feedback; speech motor control; variability.
Copyright © 2022 Wang and Max.
Conflict of interest statement
The authors declare that the research was conducted in the absence of any commercial or financial relationships that could be construed as a potential conflict of interest.
Figures


Similar articles
-
Speech auditory-motor adaptation to formant-shifted feedback lacks an explicit component: Reduced adaptation in adults who stutter reflects limitations in implicit sensorimotor learning.Eur J Neurosci. 2021 May;53(9):3093-3108. doi: 10.1111/ejn.15175. Epub 2021 Apr 10. Eur J Neurosci. 2021. PMID: 33675539 Free PMC article.
-
Perturbing the consistency of auditory feedback in speech.Front Hum Neurosci. 2022 Aug 25;16:905365. doi: 10.3389/fnhum.2022.905365. eCollection 2022. Front Hum Neurosci. 2022. PMID: 36092651 Free PMC article.
-
Does pre-speech auditory modulation reflect processes related to feedback monitoring or speech movement planning?bioRxiv [Preprint]. 2024 Jul 13:2024.07.13.603344. doi: 10.1101/2024.07.13.603344. bioRxiv. 2024. Update in: Neurosci Lett. 2024 Nov 20;843:138025. doi: 10.1016/j.neulet.2024.138025. PMID: 39026879 Free PMC article. Updated. Preprint.
-
Disruption of speech motor adaptation with repetitive transcranial magnetic stimulation of the articulatory representation in primary motor cortex.Cortex. 2021 Dec;145:115-130. doi: 10.1016/j.cortex.2021.09.008. Epub 2021 Oct 6. Cortex. 2021. PMID: 34717269 Free PMC article.
-
Pediatric Responses to Fundamental and Formant Frequency Altered Auditory Feedback: A Scoping Review.Front Hum Neurosci. 2022 May 17;16:858863. doi: 10.3389/fnhum.2022.858863. eCollection 2022. Front Hum Neurosci. 2022. PMID: 35664350 Free PMC article.
Cited by
-
Neurophysiological evidence of sensory prediction errors driving speech sensorimotor adaptation.bioRxiv [Preprint]. 2024 Sep 17:2023.10.22.563504. doi: 10.1101/2023.10.22.563504. bioRxiv. 2024. Update in: J Neurosci. 2025 Jul 2;45(27):e2084242025. doi: 10.1523/JNEUROSCI.2084-24.2025. PMID: 37961099 Free PMC article. Updated. Preprint.
-
Individual sensorimotor adaptation characteristics are independent across orofacial speech movements and limb reaching movements.J Neurophysiol. 2022 Sep 1;128(3):696-710. doi: 10.1152/jn.00167.2022. Epub 2022 Aug 10. J Neurophysiol. 2022. PMID: 35946809 Free PMC article.
-
Perceptual formant discrimination during speech movement planning.PLoS One. 2024 Apr 2;19(4):e0301514. doi: 10.1371/journal.pone.0301514. eCollection 2024. PLoS One. 2024. PMID: 38564597 Free PMC article.
-
Mechanisms of sensorimotor adaptation in a hierarchical state feedback control model of speech.PLoS Comput Biol. 2023 Jul 28;19(7):e1011244. doi: 10.1371/journal.pcbi.1011244. eCollection 2023 Jul. PLoS Comput Biol. 2023. PMID: 37506120 Free PMC article.
-
Neurophysiological Evidence of Sensory Prediction Errors Driving Speech Sensorimotor Adaptation.J Neurosci. 2025 Jul 2;45(27):e2084242025. doi: 10.1523/JNEUROSCI.2084-24.2025. J Neurosci. 2025. PMID: 40425317 Free PMC article.
References
-
- Boersma P. (2001). Praat, a system for doing phonetics by computer. Glot Int. 5 341–345.
-
- Brockwell P. J., Davis R. A. (2016). Introduction to Time Series and Forecasting. Berlin: Springer.
-
- Cai S., Boucek M., Ghosh S., Guenther F., Perkell J. (2008). “A system for online dynamic perturbation of formant trajectories and results from perturbations of the mandarin triphthong /iau/,”in Proceedings of the 8th ISSP, University of Strasbourg, Strasbourg.
Grants and funding
LinkOut - more resources
Full Text Sources