. 2022 Jul 6;7(28):24384-24395.
doi: 10.1021/acsomega.2c01817. eCollection 2022 Jul 19.

Additive Manufacturing of Viscoelastic Polyacrylamide Substrates for Mechanosensing Studies

Affiliations

Additive Manufacturing of Viscoelastic Polyacrylamide Substrates for Mechanosensing Studies

Fardeen Kabir Protick et al. ACS Omega. .

Abstract

Polymerized polyacrylamide (PAA) substrates are linearly elastic hydrogels that are widely used in mechanosensing studies due to their biocompatibility, wide range of functionalization capability, and tunable mechanical properties. However, such cellular response on purely elastic substrates, which do not mimic the viscoelastic living tissues, may not be physiologically relevant. Because the cellular response on 2D viscoelastic PAA substrates remains largely unknown, we used stereolithography (SLA)-based additive manufacturing technique to create viscoelastic PAA substrates with tunable mechanical properties that allow us to identify physiologically relevant cellular behaviors. Three PAA substrates of different complex moduli were fabricated by SLA. By embedding fluorescent markers during the additive manufacturing of the substrates, we show a homogeneous and uniform composition throughout, which conventional manufacturing techniques cannot produce. Rheological investigation of the additively manufactured PAA substrates shows a viscoelastic behavior with a 5-10% loss moduli compared to their elastic moduli, mimicking the living tissues. To understand the cell mechanosensing on the dissipative PAA substrates, single live cells were seeded on PAA substrates to establish the basic relationships between cell traction, cytoskeletal prestress, and cell spreading. With the increasing substrate moduli, we observed a concomitant increase in cellular traction and prestress, but not cell spreading, suggesting that cell spreading can be decoupled from traction and intracellular prestress in physiologically relevant environments. Together, additively manufactured PAA substrates fill the void of lacking real tissue like viscoelastic materials that can be used in a variety of mechanosensing studies with superior reproducibility.


Conflict of interest statement

The authors declare no competing financial interest.

Figures

Figure 1
Figure 1
Additive manufacturing of viscoelastic PAA substrates. (A) Schematic of an SLA 3D printer showing major components. A representative circular design of the substrate array is displayed in the resin tank where the light source emits UV light for photopolymerization. (B) 3D model of an array of substrates is used for printing. The substrates can be printed in any desired shape and thickness as low as 50 μm. Here, a circular substrate array (yellow) is shown on an activated glass slide. (C) Additively manufactured PAA substrates on an activated glass slide. As shown in the 3D model, six gels were printed on the activated glass slide. A reusable confinement boundary (gray) is affixed on the slide for subsequent cleaning, functionalization, and experimentation. (D,E) Additively manufactured PAA substrates show tunable viscoelastic properties. Soft (green), intermediate (blue), and stiff (orange) substrates show 5–10% viscous dissipation capacity compared to their respective elastic modulus. Data represent mean ± s.e. and are from 3 independent experiments.
Figure 2
Figure 2
Increasing the stiffness reduces the physical swelling and fluid retention capability of PAA hydrogels. (A) Swelling ratio estimation of three different concentrations (10% acrylamide: 0.15% bis-acrylamide, 10% acrylamide: 0.3% bis-acrylamide, and 10% acrylamide: 1.2% bis-acrylamide) of gels is presented here. The lowest bis-acrylamide concentration was labeled as soft gels while intermediate and high bis-acrylamide concentrations were labeled as intermediate and stiff gels, respectively. Soft gels (green line) show the highest swelling compared to intermediate (blue line) and stiff (orange line) gels. n = 10 for each gel from 3 independent experiments. Data represents mean ± s.e. (B) Saturation time of three different substrates is shown here. The soft gels require the highest time to reach saturation while the stiff gels require the least time to reach saturation. n = 10 for each gel from 3 independent experiments. Data represents mean ± s.e.
Figure 3
Figure 3
Pore size comparison of additively manufactured PAA substrates by SEM studies. (A–C) SEM images of additively manufactured PAA substrates show varying pore sizes. The pore size was highest for the soft gel while the lowest for the stiff gels. The pore size of intermediate gels was found to be similar to the soft gels. (D) Pore area quantification of soft, intermediate, and stiff substrates. A box-whisker plot shows the distribution of pores size for each substrate. (E) Box-whisker plot showing the circularity index or CSI of each pore for soft, intermediate, and stiff substrates. (F) Box-whisker plot showing the distribution of the boundary thickness. As the stiffness increased, the pore thickness increased concomitantly.
Figure 4
Figure 4
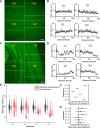
Embedded microbead distribution analysis of additively manufactured and conventionally made PAA substrates. (A,B) Fluorescence image of an additively manufactured PAA substrate. The embedded microbead labeled with FITC serves as a fiducial marker. The image was divided into four quadrants (Q1, Q2, Q3, and Q4), and four arbitrary lines were drawn on each quadrant. A line plot of representative lines (white) from each quadrant of the additively manufactured substrate is presented here. Gray value distribution remained similar for all four lines suggesting that there is a homogenous composition. The presence of microbeads tagged with FITC gives rise to the peaks on the plot. (C,D) Fluorescence image of a conventionally prepared substrate is displayed here. As before, the image was divided into four quadrants (Q1–Q4) and four arbitrary lines were drawn on each quadrant. Streaks and clusters of microbeads can be observed throughout the image resulting in a heterogeneous composition. The gray value of a representative line (white) from each quadrant of conventionally prepared substrate shows a large variation in bead distribution. (E) Mean gray value distribution in all four quadrants of additively manufactured (gray) and conventionally made (red) substrates are shown. Mean gray value calculation is performed from four representative lines of each quadrant. (F) Relative comparison between each quadrant of the conventional substrate is shown. A large variation in the mean gray value indicates a significant difference in each quadrant. For a homogeneous distribution, the difference should be close to zero; p < 0.05. (G) Relative comparison between each quadrant of additively manufactured substrates showing slight variation in mean value, suggesting a homogeneous distribution; p > 0.05.
Figure 5
Figure 5
Surface feature analysis of additively manufactured PAA substrates by atomic force microscopy. (A) Peak force quantitative nanomechanical mapping (PFQNM) of PAA substrates in 2D is displayed here. Visible surface features were mapped in peak force error. Surface anomalies and features are visible at this scale. (B) Peak force distribution in 3D format. High-resolution descriptive image showing ridge and crevices formation along the plane. (C–E) Deformation maps of soft (c), intermediate (d), and stiff (e) substrates are shown here.
Figure 6
Figure 6
TFM analysis of B16F1 mouse melanoma cells on additively manufactured PAA substrates of varying stiffness. (A) Schematic illustration of RGDfK peptide conjugation on an additively manufactured PAA substrate. (B) FITC-conjugated microbead distribution on the PAA substrate surface is presented here before (stressed) and after (relaxed) cell trypsinization. The relative displacement of microbeads can be readily observed before and after trypsinization images. (C) Phase and traction maps of B16F1 cells on additively manufactured PAA substrates of varying stiffnesses are displayed here. The top, middle, and bottom rows show the soft, intermediate, and stiff gel responses, respectively. (D) rms traction of B16F1 cells on different stiffness gels shows that with increasing gel stiffness, rms traction increases linearly. n = 12, data represents mean ± s.e. R2 ≈ 1.0. (E) Concomitant increase in cell prestress is also observed with increasing gel stiffness. n = 12, data represents mean ± s.e. R2 ≈ 1.0. (F) Very similar cell spreading is observed across all substrate rigidity; p > 0.05, n = 12, data represents mean ± s.e.

References

    1. Chowdhury F.; Huang B.; Wang N. Cytoskeletal prestress: The cellular hallmark in mechanobiology and mechanomedicine. Cytoskeleton 2021, 78, 249–276. 10.1002/cm.21658. - DOI - PMC - PubMed
    1. Petrie R. J.; Yamada K. M. At the leading edge of three-dimensional cell migration. J. Cell Sci. 2012, 125, 5917.10.1242/jcs.093732. - DOI - PMC - PubMed
    1. Espina J. A.; Marchant C. L.; Barriga E. H. Durotaxis: the mechanical control of directed cell migration. FEBS J. 2022, 289, 2736.10.1111/febs.15862. - DOI - PMC - PubMed
    1. Shin M. E.; He Y.; Li D.; Na S.; Chowdhury F.; Poh Y.-C.; Collin O.; Su P.; de Lanerolle P.; Schwartz M. A.; Wang N.; Wang F. Spatiotemporal organization, regulation, and functions of tractions during neutrophil chemotaxis. Blood 2010, 116, 3297–3310. 10.1182/blood-2009-12-260851. - DOI - PMC - PubMed
    1. Kumar A.; Placone J. K.; Engler A. J. Understanding the extracellular forces that determine cell fate and maintenance. Development 2017, 144, 4261–4270. 10.1242/dev.158469. - DOI - PMC - PubMed