. 2022 Jul 1;7(28):24551-24560.
doi: 10.1021/acsomega.2c02319. eCollection 2022 Jul 19.

Experimental and Analytical Framework for "Mix-and-Read" Assays Based on Split Luciferase

Affiliations

Experimental and Analytical Framework for "Mix-and-Read" Assays Based on Split Luciferase

Nikki McArthur et al. ACS Omega. .

Abstract

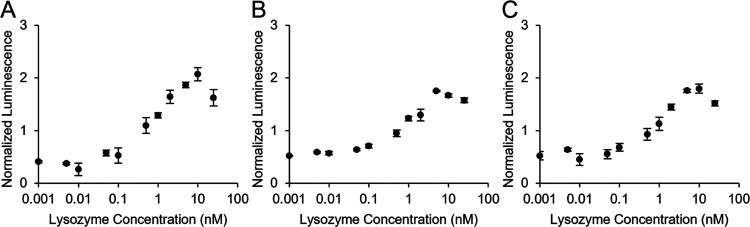
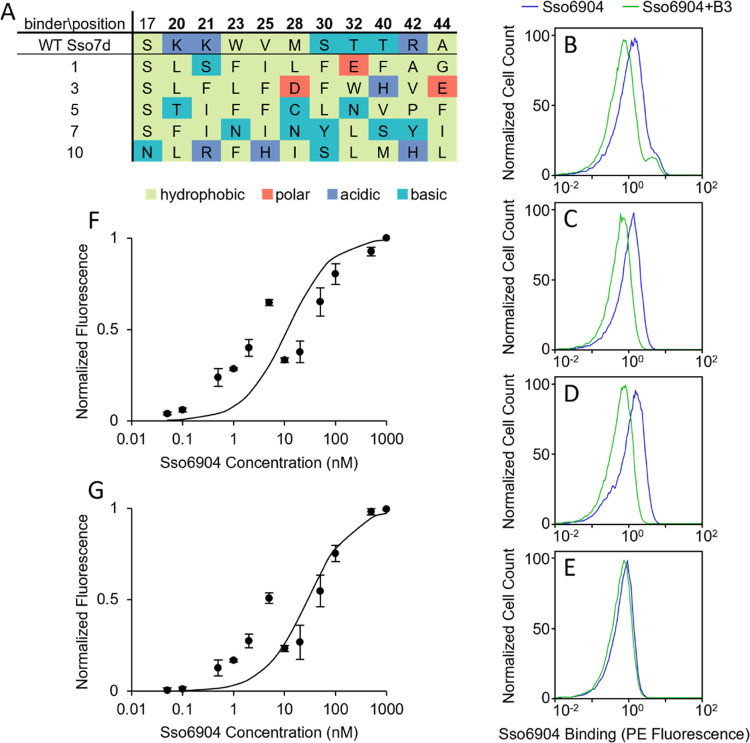
The use of immunodetection assays including the widely used enzyme-linked immunosorbent assay (ELISA) in applications such as point-of-care detection is often limited by the need for protein immobilization and multiple binding and washing steps. Here, we describe an experimental and analytical framework for the development of simple and modular "mix-and-read" enzymatic complementation assays based on split luciferase that enable sensitive detection and quantification of analytes in solution. In this assay, two engineered protein binders targeting nonoverlapping epitopes on the target analyte were each fused to nonactive fragments of luciferase to create biosensor probes. Binding proteins to two model targets, lysozyme and Sso6904, were isolated from a combinatorial library of Sso7d mutants using yeast surface display. In the presence of the analyte, probes were brought into close proximity, reconstituting enzymatic activity of luciferase and enabling detection of low picomolar concentrations of the analyte by chemiluminescence. Subsequently, we constructed an equilibrium binding model that relates binding affinities of the binding proteins for the target, assay parameters such as the concentrations of probes used, and assay performance (limit of detection and concentration range over which the target can be quantified). Overall, our experimental and analytical framework provides the foundation for the development of split luciferase assays for detection and quantification of various targets.


Conflict of interest statement

The authors declare no competing financial interest.

Figures

Figure 1
Figure 1
Split luciferase mix-and-read assay for the detection and quantification of a soluble target. Binders to the target molecule, lysozyme (PDB: 2CDS; red), in this case, derived from the Sso7d scaffold protein (PDB: 1SSO; blue and purple), are fused to N- or C-terminal fragments of split luciferase (orange) to create biosensor probes. Upon addition of the probes to a solution containing the target, probes bind to the target, and, because of the proximity created by these binding events, fragments of the split luciferase assemble to create an active luciferase enzyme. When the substrate is added, a luminescent signal is produced corresponding to the concentration of the target in solution.
Figure 2
Figure 2
Split luciferase lysozyme detection assay with sNLUC and NanoBiT systems. Detection of lysozyme at different concentrations was measured with the mix-and-read split luciferase detection assay using either 1 μM sNLUC-based probes, CTL1-NLF1 and NLF2-NTL1 (A), or 100 nM NanoBiT-based probes, CTL1-LgBiT and SmBiT-NTL1 (B). Luminescence is normalized by the mean luminescent signal at all lysozyme concentrations for each repeat. Three independent replicates were conducted. Error bars indicate standard error.
Figure 3
Figure 3
Optimized split luciferase lysozyme detection assay. Detection of lysozyme at different concentrations was measured with the mix-and-read split luciferase detection assay with 1 nM (A), 5 nM (B), or 10 nM (C) probes CTL1-LgBiT and SmBiT-NTL1. Luminescence is normalized by the mean luminescent signal at all lysozyme concentrations for each repeat. Four independent replicates were conducted at each probe concentration. Error bars indicate standard error.
Figure 4
Figure 4
Identification of Sso7d-derived binders to nonoverlapping Sso6904 epitopes. (A) Sequences of wild-type Sso7d and unique binders to Sso6904 are shown. The 10 positions mutated in the original Sso7d library are displayed in bold. (B–E) Results of the competitive binding experiments with soluble binder 3 and yeast surface-displayed binder 1 (B), 5 (C), 7 (D), or 10 (E) are shown. Each flow cytometry plot depicts the normalized number of cells bound to Sso6904 via their surface-displayed binder, measured by PE fluorescence, in the presence (green curve) or absence (blue curve) of excess binder 3. (F–G) Apparent KDs of Snof3 (F) and Snof10 (G) to Sso6904 were estimated using yeast surface titrations. Mean fluorescence was normalized by the maximum fluorescence of each repeat and KD was calculated using a global nonlinear least-squares fit across three independent replicates for each binder. The KD of Snof3 is 11 nM (68% confidence interval: 5.1–24 nM) and the KD of Snof10 is 28 nM (68% confidence interval: 17–48 nM). Error bars correspond to standard error.
Figure 5
Figure 5
Split luciferase Sso6904 detection assay. Detection of Sso6904 at different concentrations was measured with the mix-and-read split luciferase detection assay using 100 nM Snof3-LgBiT and 100 nM SmBiT-Snof10. Luminescence is normalized by the mean luminescent signal at all Sso6904 concentrations for each repeat. Three independent replicates were conducted. Error bars indicate standard error.
Figure 6
Figure 6
Proposed equilibrium model for the split luciferase assay. This model describes the split luciferase system when the target is not present (A) and when the target is present (B). Binder proteins (blue and purple); split luciferase fragments (orange); unbound target (L, red); unbound probe 1 (P1); unbound probe 2 (P2); luminescent, signal-producing complexes (CEO, C, CLB1O, CLB2O, and CL); nonluminescent complexes (CBO, CLB1, CLB2, and CLO); biomolecular dissociation constants; and unimolecular dissociation constants are shown.
Figure 7
Figure 7
Output of the equilibrium binding model. (A, B) Total luminescent output (CT) versus total target concentration (LT) curves given by the equilibrium model fit to split the luciferase lysozyme detection assay data (A) or split luciferase Sso6904 detection assay data (B). Curves show model simulation, solid dots are three repeats of experimental data, and open circles are averages of experimental data. Luminescence was normalized by dividing data by maximum luminescent output, averaging these values at each target concentration over the three repeats to create an average curve, and applying a multiplier to each repeat to minimize the distance between it and the average curve. (C) Model-derived CT vs LT curve and LoB, LoD, lower LoQ (LoQL), upper LoQ (LoQU), and LT at the maximum luminescence (LTmax) predictions for the lysozyme detection system at PT = 0.3 nM. (D) Plot of how the LoB, LoD, quantifiable region, and LTmax varies with respect to probe concentration PT for the lysozyme detection system.

Similar articles

Cited by

References

    1. Ghorbani F.; Abbaszadeh H.; Mehdizadeh A.; Ebrahimi-Warkiani M.; Rashidi M. R.; Yousefi M. Biosensors and Nanobiosensors for Rapid Detection of Autoimmune Diseases: A Review. Microchimica Acta 2019, 186, 1–11. 10.1007/s00604-019-3844-4. - DOI - PubMed
    1. Qian L.; Li Q.; Baryeh K.; Qiu W.; Li K.; Zhang J.; Yu Q.; Xu D.; Liu W.; Brand R. E.; Zhang X.; Chen W.; Liu G. Biosensors for Early Diagnosis of Pancreatic Cancer: A Review. Transl. Res. 2019, 213, 67–89. 10.1016/j.trsl.2019.08.002. - DOI - PubMed
    1. Yousefi M.; Dehghani S.; Nosrati R.; Zare H.; Evazalipour M.; Mosafer J.; Tehrani B. S.; Pasdar A.; Mokhtarzadeh A.; Ramezani M. Aptasensors as a New Sensing Technology Developed for the Detection of MUC1 Mucin: A Review. Biosens. Bioelectron. 2019, 130, 1–19. 10.1016/j.bios.2019.01.015. - DOI - PubMed
    1. Engvall E.; Perlmann P. Enzyme-Linked Immunosorbent Assay (ELISA) Quantitative Assay of Immunoglobulin G. Immunochemistry 1971, 8, 871–874. 10.1016/0019-2791(71)90454-X. - DOI - PubMed
    1. Chung C. I.; Makino R.; Ohmuro-Matsuyama Y.; Ueda H. Development of a Fluorescent Protein-Antibody Förster Resonance Energy Transfer Probe for the Detection and Imaging of Osteocalcin. J. Biosci. Bioeng. 2017, 123, 272–276. 10.1016/j.jbiosc.2016.09.003. - DOI - PubMed