. 2022 Feb;37(2):142-180.
doi: 10.1002/jqs.3354. Epub 2021 Aug 25.

Neanderthals on the Lower Danube: Middle Palaeolithic evidence in the Danube Gorges of the Balkans

Affiliations

Neanderthals on the Lower Danube: Middle Palaeolithic evidence in the Danube Gorges of the Balkans

Dušan Borić et al. J Quat Sci. 2022 Feb.

Abstract

The article presents evidence about the Middle Palaeolithic and Middle to Upper Palaeolithic transition interval in the karst area of the Danube Gorges in the Lower Danube Basin. We review the extant data and present new evidence from two recently investigated sites found on the Serbian side of the Danube River - Tabula Traiana and Dubočka-Kozja caves. The two sites have yielded layers dating to both the Middle and Upper Palaeolithic and have been investigated by the application of modern standards of excavation and recovery along with a suite of state-of-the-art analytical procedures. The presentation focuses on micromorphological analyses of the caves' sediments, characterisation of cryptotephra, a suite of new radiometric dates (accelerator mass spectrometry and optically stimulated luminescence) as well as proteomics (zooarchaeology by mass spectrometry) and stable isotope data in discerning patterns of human occupation of these locales over the long term.

Keywords: Danube Gorges; OSL dating; Palaeolithic; ZooMS; cryptotephra; radiocarbon dating.


Figures

Figure 1
Figure 1
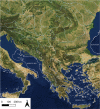
Principal sites with Middle and Initial/Early Upper Palaeolithic sequences in south‐eastern Europe. Bathymetric contours show the drop of sea levels ‐110 m; source: the General Bathymetric Chart of the Oceans (GEBCO) https://www.gebco.net/data_and_products/gridded_bathymetry_data/. Base map prepared by Andrea Zupancich. Sites: 1. Asprochaliko; 2. Bacho Kiro; 3. Baranica; 4. Bioče; 5. Coșava I; 6. Crvena Stijena; 7. Crvenka‐At; 8. Gajtan; 9. Golema Pešt; 10. Hadži Prodanova; 11. Klissoura; 12. Kozarnika; 13. Krapina; 14. Lakonis; 15. Londža; 16. Mujina; 17. Pešturina; 18. Petrovaradin; 19. Românești‐Dumbrăvița; 20. Šalitrena; 21. Samuilitsa II; 22. Smolućka; 23. Temnata; 24. Theopetra; 25. Tinkova; 26. Vindija; 27. Zobište. [Color figure can be viewed at wileyonlinelibrary.com]
Figure 2
Figure 2
Sites with Middle and Upper Palaeolithic sequences in the Danube Gorges area. Base map elevation data source: ASTER GDEM (‘ASTER GDEM is a product of METI and NASA’) courtesy NASA/JPL‐Caltech. Figure prepared by Karol Wehr and Dušan Borić.
Figure 3
Figure 3
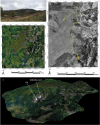
1: Photogrammetry‐derived TT cave area orthomosaic overlain on the World Imagery dataset (Esri – 1 m cell size south‐east Europe) demonstrating the improved quality for the investigated area when compared with openly accessible imagery datasets; 2: Snapshot of the TT area 3D model; 3: View of the current location of the Roman plaque Tabula Traiana in the vicinity of TT Cave. [Color figure can be viewed at wileyonlinelibrary.com]
Figure 4
Figure 4
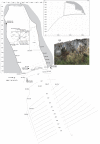
Plan of TT with excavation areas and locations of radiometric and sediment samples. Asterisk marks samples that produced results beyond the limit of radiocarbon dating. [Color figure can be viewed at wileyonlinelibrary.com]
Figure 5
Figure 5
A representative west–east stratigraphic section at TT with the location of micromorphological samples. [Color figure can be viewed at wileyonlinelibrary.com]
Figure 6
Figure 6
A representative north–south stratigraphic section at TT with the location of micromorphological and OSL samples. [Color figure can be viewed at wileyonlinelibrary.com]
Figure 7
Figure 7
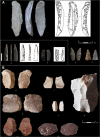
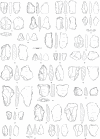
A selection of knapped stone artefacts from (A) Upper Palaeolithic stratigraphic units, and (B) Middle Palaeolithic stratigraphic units at TT; 1: blade with bilateral continuous retouch (SU41, quad. 3/26, depth 91.311 m); 2: Dufour bladelet with abrupt and marginal alternating retouch (SU221, quad. 4.5/16, spit 8); 3: micro‐bladelet, bilateral continuous retouch (SU216, quad. 4/25); 4: bladelet blank (SU207); 5: retouched bladelet, distal end (SU207/1, quad. 3/30); 6: rejuvenation flake of the éclat débordant type (Tr. 1/2004, quad. A, spit 10); 7: Levallois flake (SU212x.8); 8: rejuvenation flake of the éclat débordant type (Tr. 1/2004, quad. C, spit 10); 9: laminar blank (SU212x.4); 10: single‐platform core (SU221, quad. 5/18, spit 11); 11: retouched flake (SU226x.89, spit 12); 12: scraper (SU226x.52, spit 11). [Color figure can be viewed at wileyonlinelibrary.com]
Figure 8
Figure 8
1: Photogrammetry‐derived Dubočka Cave area orthomosaic overlying the World Imagery dataset (Esri composite – 1 m cell size in south‐eastern Europe) demonstrating the improved quality for the investigated area when compared with openly accessible imagery datasets; 2: Dubočka area orthomosaic (in greyscale, for contrast) and the outline of the underlying cave systems (after Zlokolica‐Mandić et al., : 108); 3: Snapshot of the Dubočka area 3D model. [Color figure can be viewed at wileyonlinelibrary.com]
Figure 9
Figure 9
Plan of DK with excavation areas and locations of radiometric samples.
Figure 10
Figure 10
East‐facing stratigraphic sections of Trench 1/2013 at DK and locations of micromorphological samples. [Color figure can be viewed at wileyonlinelibrary.com]
Figure 11
Figure 11
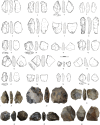
A selection of knapped stone artefacts from Pleistocene stratigraphic units at DK; 1: retouched flake (SU4.x6, quad. 101/100/A, spit 5); 2: scraper (SU4.x1, quad. 101/98, spit 4); 3: retouched blade (SU4, quad. 101/100/D, spit 5); 4: retouched blade (SU2, quad. 100/101/D, spit 3); 5: scraper (SU4.x10, quad. 100/99/B, spit 5); 6: denticulate (SU4.x3, quad. 101/99, spit 4); 7: endscraper (SU4, quad. 100/99, spit 4); 8: retouched flake (SU4, quad. 101/100/D, spit 5); 9: retouched chip (SU4, quad. 101/99/D, spit 5); 10: point (SU4, quad. 100/101/A, spit 3); 11: scraper+truncation (SU4, quad. 100/101/A, spit 5); 12: denticulate (SU2, quad. 100/99, spit 2); 13. denticulate (SU4, quad. 100/101/D, spit 5); 14: point (SU5, quad. 101/101/A, spit 5); 15: truncation (SU4, quad. 101/99/D, spit 5); 16: retouched flake (SU4.x4, quad. 101/100/D, spit 5); 17: convergent scraper (SU4.x28, quad. 100/98/A, spit 6); 18: point (SU4.x15, quad. 100/101/D, spit 6); 19: scraper (SU4, 100/98/A spit 7); 20: denticulate (SU4.x17, quad. 100/98/D, spit 4); 21: sidescraper (SU4.x1, quad. 101/101/A, spit 6); 22: retouched flake (SU10.x2, quad. 100/98/D, spit 8); 23: endscraper (SU4.x18, quad. 101/101/A, spit 6); 24: scraper (SU4, quad. 100/98/B, spit 6); 25: retouched flake (SU4.x39, quad. 101/98/B, spit 7); 26: borer (SU4.x41, quad. 101/98/B, spit 7); 27: scraper (SU4.x35, quad. 100/98/A, spit 7); 28: truncation (SU3, quad. 101/100, spit 2); 29: retouched flake (SU4.x34, quad. 100/98/B, spit 7).
Figure 12
Figure 12
A selection of knapped stone artefacts from Pleistocene stratigraphic units at DK. 1: retouched blade (SU4, quad. 100/98/A, spit 7); 2: retouched blade (SU4.x32, quad. 101/98/B, spit 7); 3: retouched flake (SU4, quad. 100/98/C, spit 7); 4: denticulate (SU4, quad. 100/98/A, spit 7); 5: convergent scraper (SU4.x32, quad. 101/98/B, spit 7); 6: retouched blade (SU4.x25, quad. 101/99/D, spit 6); 7: retouched flake (SU4.x45, quad. 100/98/B, spit 8); 8: retouched blade (SU3, quad. 100/99, spit 3); 9. truncation (SU4.x27, quad. 101/99/D, spit 6); 10: scraper, yellow white‐spotted flint (SU4.x43, quad. 101/98/C, spit 7); 11: retouched flake (SU4, quad. 100/98/A, spit 7); 12: retouched flake (SU4.x34, quad. 100/98/B, spit 7); 13: convergent scraper (SU4.x38, quad. 100/98/C, spit 7); 14: retouched flake (SU4.x33, quad. 101/98/B, spit 7); 15: retouched flake (SU4.x5, 100/98/A spit 5); 16: scraper (SU4, quad. 100/98/A, spit 7); 17: endscraper (SU4.x44, quad. 101/98/B, spit 8); 18: retouched flake (SU4, quad. 100/98/C, spit 7); 19: retouched blade (SU4, quad. 101/98/B, spit 5); 20: convergent scraper (SU4, quad. 100/98/A, spit 7); 21: Levallois point (spoil, bag 65); 22: centripetal core (SU4, quad. 100/98/A, spit 7); 23: Levallois core (SU4, quad. 100/98/A, spit 6); 24: Levallois core (SU4.x23, quad. 101/99, spit 6); 25: Levallois core (SU4.x59, quad. 996/997, spit 19); 26: Levallois core (SU4.x22, quad. 101/101/C, spit 6). [Color figure can be viewed at wileyonlinelibrary.com]
Figure 13
Figure 13
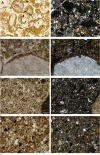
Tabula Traiana Cave; a. Photomicrograph of the bioturbated calcitic fabric with a few bone fragments, basal fabric unit 1, sample 1 (plane‐polarised light; frame width = 4.5 mm); b. Photomicrograph of the bioturbated, heterogeneous mixture of calcitic silt, comminuted very fine charred and plant material and amorphous sesquioxide‐replaced plant tissues, fabric unit 4, sample 1 (plane‐polarised light; frame width = 4.5 mm); c. Photomicrograph of the phosphatised micritc silt with common amorphous sesquioxide‐replaced plant tissue matter and included very fine to fine charcoal, upper fabric unit 5 sample 1 (plane‐polarised light; frame width = 4.5 mm); d. Photomicrograph of the calcitic ash fabric and a weathered bone fragment (upper left), sample 2 (plane‐polarised light; frame width = 4.5 mm); e. Photomicrograph of the thin linear zone of calcareous silt and fine charcoal dust crusts at a clear planar boundary on the underlying weathered karst floor of the cave, sample 2 (plane‐polarised light; frame width = 4.5 mm); f. Photomicrograph of the bioturbated calcitic silty clay with abundant included fine sand‐size phosphatised bone fragments, sample 3 (cross‐polarised light; frame width = 4.5 mm). [Color figure can be viewed at wileyonlinelibrary.com]
Figure 14
Figure 14
Photomicrographs of sediment thin sections from Tabula Traiana. 1. a: phytoliths in context 207, PPL. b: same as a, XPL; 2. a: granostriated b‐fabric; silt capping coating skeleton grains, PPL. b: same as a, XPL. [Color figure can be viewed at wileyonlinelibrary.com]
Figure 15
Figure 15
The column 1 and 2 results of tephra glass shard counting within sampled stratigraphy in TT. Distribution of tephra glass shards by depth within cryptotephra column 1 and column 2. Right‐hand columns indicate archaeological units and boundaries. Wide blue bars show indicator shard counts from initial low‐resolution samples (aggregated from multiple bag samples), estimated as shards per ~2 g dry sediment weight. Green bars show high‐resolution (2 cm depth intervals) samples spanning intervals where tephra glass shards had been found in above‐background concentrations and are quantified as shards per 1 g dry sediment. Red stars pinpoint tephra layers T1 and T2 for which samples were re‐extracted and run for geochemical analyses. [Color figure can be viewed at wileyonlinelibrary.com]
Figure 16
Figure 16
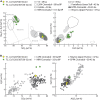
Selected major and minor element concentrations in T1 and T2 cryptotephra glass shards compared with published glass shard data from widespread tephra layers generated by central to eastern Mediterranean volcanic eruptions dated to between 50 and 29 ka bp. [Color figure can be viewed at wileyonlinelibrary.com]
Figure 17
Figure 17
Photomicrographs of sediment thin sections from DK. 1a: cryogenic loose granular microstructure with granostriated b‐fabric; silt cappings completely coating skeleton grains, PPL, context 10. 1b: as in a, XPL; 2a: silt capping on metamorphic quartz, PPL, context 10; 2b: as in a, XPL; 3a: bone‐dominated sediment, PPL, context 10. 3b: as in a, XPL; 4a: amorphous organic matter, PPL, context 1; 4b: as in a, XPL. [Color figure can be viewed at wileyonlinelibrary.com]
Figure 18
Figure 18
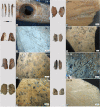
Cutmarked bone specimens from TT selected for AMS dating. [Color figure can be viewed at wileyonlinelibrary.com]
Figure 19
Figure 19
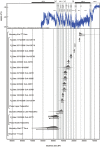
Bayesian modelling of all available dates from TT plotted against the North Greenland (NGRIP) δ18Oice record and event stratigraphy; Greenland Stadial/Interstadial (GS/GI) cycles for the last 48 kyr bp (before 2000 ad). For the radiocarbon measurements, distributions in outline are the results of simple radiocarbon calibrations and solid distributions are the output from the chronological model. The large square brackets and OxCal v. 4.4 CQL2 keywords define the overall model exactly. [Color figure can be viewed at wileyonlinelibrary.com]
Figure 20
Figure 20
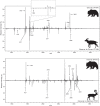
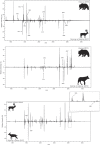
MALDI spectra identifications of fragmented bone specimens from TT. Masses of the key markers used for taxonomic identification are indicated with arrows. The inset highlights that even markers with relatively low intensity values which are not visible in the full spectrum can be used for identification.
Figure 21
Figure 21
Cutmarked bone specimens from Dubočka‐Kozja selected for AMS dating. [Color figure can be viewed at wileyonlinelibrary.com]
Figure 22
Figure 22
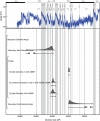
Bayesian modelling of all available dates from DK plotted against the North Greenland (NGRIP) δ18Oice record and event stratigraphy; Greenland Stadial/Interstadial (GS/GI) cycles for the last 48 kyr bp (before 2000 ad). For the radiocarbon measurements, distributions in outline are the results of simple radiocarbon calibrations, solid distributions are the output from the chronological model. The large square brackets and OxCal v. 4.4 CQL2 keywords define the overall model exactly. [Color figure can be viewed at wileyonlinelibrary.com]
Figure 23
Figure 23
MALDI spectra identifications of fragmented bone specimens from DK. Masses of the key markers used for taxonomic identification are indicated with arrows. The inset highlights a key, high mass, marker (m/z 3093) that is highly distinctive for Capra and Rangifer. While in some cases not all markers were present to provide the lowest level taxonomic identification, partial identification was possible.
Figure 24
Figure 24
Available δ13C and δ15N values (n = 34) plotted against main periods at TT and DK. Black symbols indicate specimens analysed specifically for C and N isotopes from Tabula Traiana only (n = 13, Table 7); green symbols indicate stable isotope values from AMS burns (n = 21, Table 6) that lack the three‐point calibration standard and are only indicative values. [Color figure can be viewed at wileyonlinelibrary.com]

Similar articles

Cited by

References

    1. Alex B, Mihailović D, Milošević S et al. 2019. Radiocarbon chronology of Middle and Upper Palaeolithic sites in Serbia. Journal of Archaeological Science: Reports 25: 266–279.
    1. Aitken MJ. 1985. Thermoluminescence Dating. Academic Press: London.
    1. Anghelinu M, Niță L, Sitlivy V et al. 2012. Looking around Peştera Cu Oase: The beginnings of Upper Paleolithic in Romania. Quaternary International 274: 136–157.
    1. Bae CJ, Douka K, Petraglia MD. 2017. On the origin of modern humans: Asian perspectives. Science 358: eaai9067. - PubMed
    1. Băltean IC. 2011. The Palaeolithic in Banat. In The Prehistory of Banat, Tasić N, Drașovean F (eds). The Publishing House of the Romanian Academy: Bucharest; 21–76.

LinkOut - more resources