. 2022 Jul 7:9:909499.
doi: 10.3389/fmolb.2022.909499. eCollection 2022.

Implementing a Scoring Function Based on Interaction Fingerprint for Autogrow4: Protein Kinase CK1δ as a Case Study

Affiliations

Implementing a Scoring Function Based on Interaction Fingerprint for Autogrow4: Protein Kinase CK1δ as a Case Study

Matteo Pavan et al. Front Mol Biosci. .

Abstract

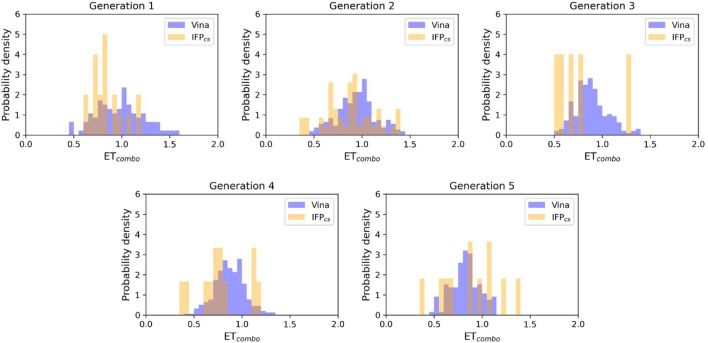
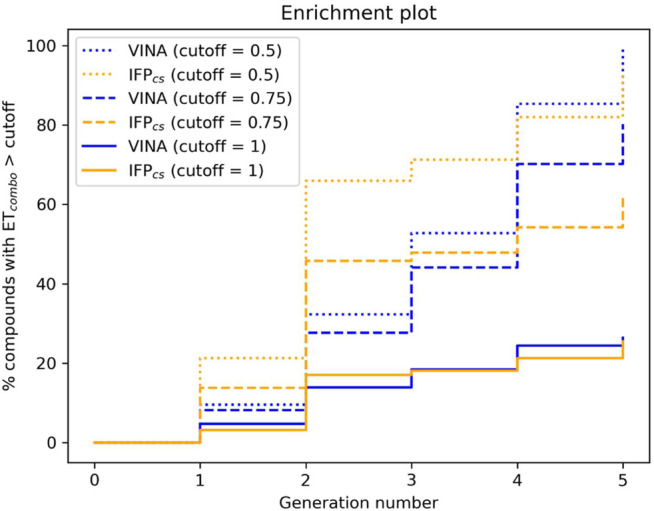
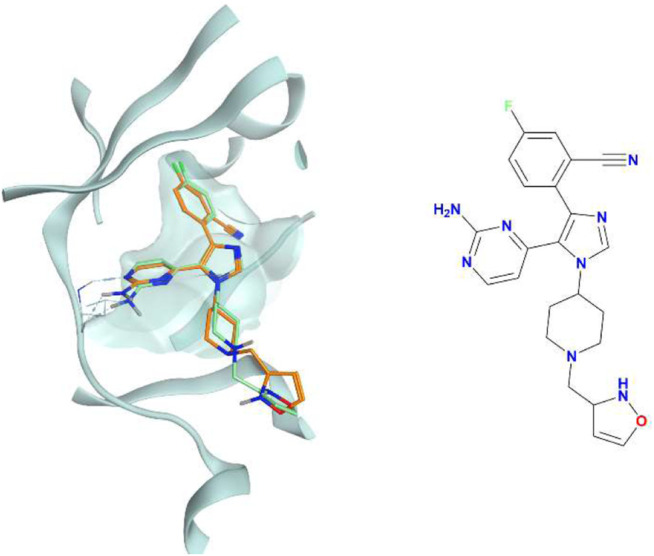
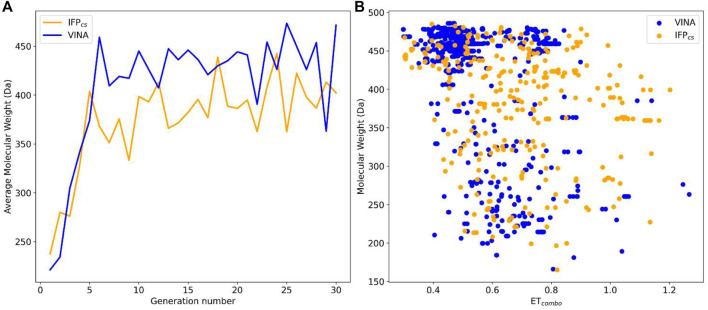
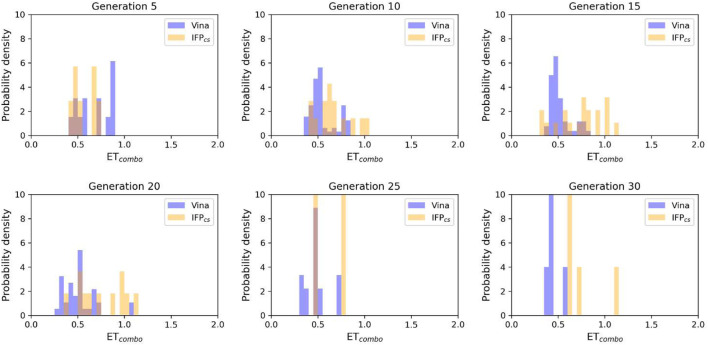
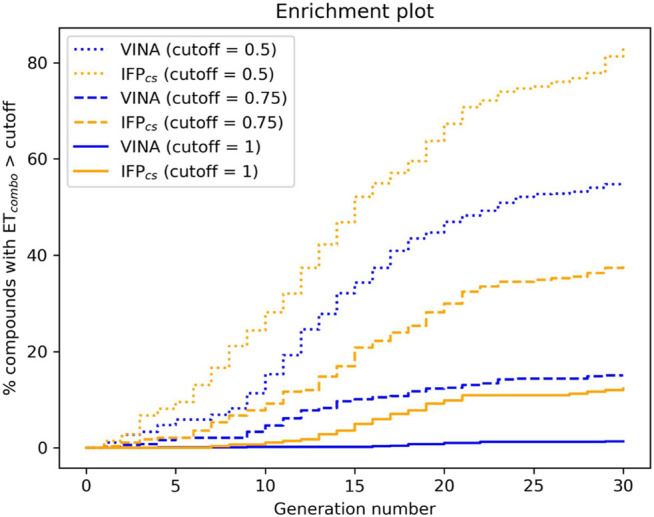
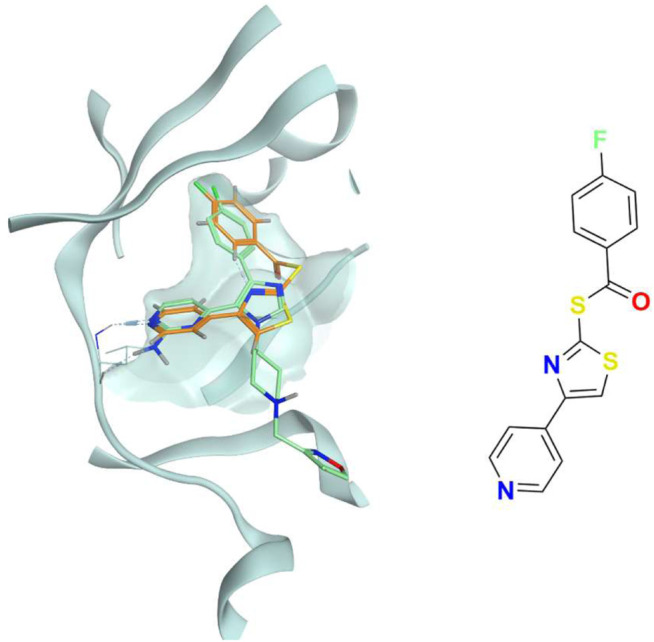
In the last 20 years, fragment-based drug discovery (FBDD) has become a popular and consolidated approach within the drug discovery pipeline, due to its ability to bring several drug candidates to clinical trials, some of them even being approved and introduced to the market. A class of targets that have proven to be particularly suitable for this method is represented by kinases, as demonstrated by the approval of BRAF inhibitor vemurafenib. Within this wide and diverse set of proteins, protein kinase CK1δ is a particularly interesting target for the treatment of several widespread neurodegenerative diseases, such as Alzheimer's disease, Parkinson's disease, and amyotrophic lateral sclerosis. Computational methodologies, such as molecular docking, are already routinely and successfully applied in FBDD campaigns alongside experimental techniques, both in the hit-discovery and in the hit-optimization stage. Concerning this, the open-source software Autogrow, developed by the Durrant lab, is a semi-automated computational protocol that exploits a combination between a genetic algorithm and a molecular docking software for de novo drug design and lead optimization. In the current work, we present and discuss a modified version of the Autogrow code that implements a custom scoring function based on the similarity between the interaction fingerprint of investigated compounds and a crystal reference. To validate its performance, we performed both a de novo and a lead-optimization run (as described in the original publication), evaluating the ability of our fingerprint-based protocol to generate compounds similar to known CK1δ inhibitors based on both the predicted binding mode and the electrostatic and shape similarity in comparison with the standard Autogrow protocol.

Keywords: Autogrow; de novo drug design; fragment growing; fragment-based drug discovery; interaction fingerprint; lead optimization; neurodegenerative diseases; protein kinase CK1δ.


Conflict of interest statement

The authors declare that the research was conducted in the absence of any commercial or financial relationships that could be construed as a potential conflict of interest.

Figures

FIGURE 1
FIGURE 1
Visual representation of the pharmacophore model used in this scientific work. Features are represented as spheres. Orange spheres indicate an aromatic ring, with an orientation determined by the small orange pin, while the pink spheres indicate a hydrogen bond donor/acceptor. For visual reference, the 4TN6 complex is also reported in this figure, with the protein represented in teal ribbons and the PFO ligand represented as orange sticks.
FIGURE 2
FIGURE 2
Two heatmaps that summarize the results of the cross-docking experiment performed before the Autogrow runs to select the protein structure to use for subsequent calculations. Panel (A) reports the results for the GOLD-Chemscore protocol, while Panel (B) encompasses the results of the PLANTS-PLANTSChemPLP one. On the vertical axis, the PDB code of the protein is reported, while on the horizontal axis the PDB code of the ligand is indicated. The colored squares report the RMSD values for the best docking pose generated by the two docking protocols according to the color bar located on the right side of the image: color ranges from blue (indicating a low RMSD; minimum value is 0 Å, indicating a perfect superposition between the docking pose and the crystal reference) to red (maximum value is 4 Å, indicating a high deviation between the docking pose and the crystal reference).
FIGURE 3
FIGURE 3
The overall “success rate” in reproducing the correct crystallographic binding mode for each of the 24 CK1δ complexes considered in the study. The “success rate” is defined as the percentage of successful docking runs for each protein in the cross-docking experiment, where a successful docking run is defined as a docking calculation where the RMSD between the best docking pose and the crystal reference falls below an arbitrarily chosen threshold value of 2 Å. Panel (A) reports the results for the GOLD-Chemscore protocol. Panel (B) reports the results for the PLANTS-PLANTSChemPLP protocol. Panel (C) encompasses the combined “success rate” for each protein, defined as the average between the success rate for each protocol. Protein from the complex 4TN6 was chosen as the most representative CK1δ structure for successive calculations.
FIGURE 4
FIGURE 4
Comparison of the performance of the two Autogrow protocols in the benchmark de novo runs regarding their ability to generate compounds that pass the pharmacophore filter. The VINA protocol is reported as a blue line, while the IFPCS one is reported as an orange line. Panel (A) depicts, for each protocol, the average molecular weight of compounds within the population that pass the pharmacophore filter on a per-generation basis. The vertical axis reports the molecular weight, while the horizontal axis reports the generation number. Panel (B) depicts, for each protocol, the distribution of generated compounds that pass the pharmacophore filter regarding their molecular weight and the similarity of shape and electrostatic properties to crystal inhibitors taken as reference. The vertical axis reports the average molecular weight in Da, while the horizontal axis reports the ET combo value. Blue dots represent compounds generated by the VINA protocol, while orange dots represent compounds generated by the IFPCS one.
FIGURE 5
FIGURE 5
The ability of the two Autogrow protocols in the benchmark de novo run to produce compounds that have a high degree of similarity concerning shape and electrostatic properties to the crystallographic ligands, chosen as reference. The probability distribution of the ET combo score for compounds populating each generation is reported as a histogram, where the vertical axis reports the probability density while the horizontal axis reports the ET combo value. Two distributions are reported within each plot: the blue bars refer to compounds generated with the VINA protocol, while the orange bars refer to compounds generated with the IFPCS one.
FIGURE 6
FIGURE 6
The capability of the two different Autogrow protocols in the benchmark de novo run to produce compounds that have a high degree of similarity concerning shape and electrostatic properties to the crystallographic ligands, chosen as reference. For each generation, the percentage of compounds within the total population whose ET combo exceeds a defined threshold value is reported. Three different cutoff values are reported: 0.50, 0.75, and 1.00, respectively.
FIGURE 7
FIGURE 7
The superposition between the docking-predicted binding mode of a high-scoring compound (MMS1) from the benchmark de novo run performed with the IFPCS scoring protocol and the reference crystal binding pose of compound PFO from the structure deposited in the Protein Data Bank with accession code 4TN6. On the left part of the image, the protein kinase CK1δ ATP binding site is reported in teal ribbon, the pose of the compound MMS1 is shown as orange sticks, while the pose of compound PFO is shown as green sticks. On the right part of the image, the chemical structure of the compound MMS1 is reported.
FIGURE 8
FIGURE 8
Comparison of the performance of the two Autogrow protocols in the benchmark lead-optimization runs regarding their ability to generate compounds that pass the pharmacophore filter. The VINA protocol is reported as a blue line, while the IFPCS one is reported as an orange line. Panel (A) depicts, for each protocol, the average molecular weight of compounds within the population that pass the pharmacophore filter on a per-generation basis. The vertical axis reports the molecular weight, while the horizontal axis reports the generation number. Panel (B) depicts, for each protocol, the distribution of generated compounds that pass the pharmacophore filter regarding their molecular weight and the similarity of shape and electrostatic properties to crystal inhibitors taken as reference. The vertical axis reports the average molecular weight in Da, while the horizontal axis reports the ET combo value. The blue dots represent compounds generated by the VINA protocol, while the orange dots represent compounds generated by the IFPCS one.
FIGURE 9
FIGURE 9
The ability of the two Autogrow protocols in the benchmark lead-optimization run to produce compounds that have a high degree of similarity with regard to shape and electrostatic properties to the crystallographic ligands, chosen as reference. The probability distribution of the ET combo score for compounds populating each generation is reported as a histogram, where the vertical axis reports the probability density while the horizontal axis reports the ET combo value. Two distributions are reported within each plot: the blue bars refer to compounds generated with the VINA protocol, while the orange bars refer to compounds generated with the IFPCS one.
FIGURE 10
FIGURE 10
The capability of the two different Autogrow protocols in the benchmark lead-optimization run to produce compounds that have a high degree of similarity concerning shape and electrostatic properties to the crystallographic ligands, chosen as reference. For each generation, the percentage of compounds within the total population whose ET combo exceeds a defined threshold value is reported. Three different cutoff values are reported: 0.50, 0.75, and 1.00, respectively.
FIGURE 11
FIGURE 11
The superposition between the docking-predicted binding mode of a high-scoring compound (MMS2) from the benchmark lead-optimization run performed with the IFPCS scoring protocol and the reference crystal binding pose of compound PFO from the structure deposited in the Protein Data Bank with accession code 4TN6. On the left part of the image, the protein kinase CK1δ ATP binding site is reported in teal ribbon, the pose of the compound MMS2 is shown as orange sticks, while the pose of compound PFO is shown as green sticks. On the right part of the image, the chemical structure of the compound MMS2 is reported.
FIGURE 12
FIGURE 12
Chemical structure of the seven fragment CK1δ inhibitors derived from the work of Bolcato et al. (2021).
FIGURE 13
FIGURE 13
Performance of the two Autogrow protocols in the prospective de novo runs regarding their ability to generate compounds that pass the pharmacophore filter. The VINA protocol is reported as a blue line, while the IFPCS one is reported as an orange line. Panel (A) depicts, for each protocol, the average molecular weight of compounds within the population that pass the pharmacophore filter on a per-generation basis. The vertical axis reports the molecular weight, while the horizontal axis reports the generation number. Panel (B) depicts, for each protocol, the distribution of generated compounds that pass the pharmacophore filter regarding their molecular weight and the similarity of shape and electrostatic properties to crystal inhibitors taken as reference. The vertical axis reports the average molecular weight in Da, while the horizontal axis reports the ET combo value. The blue dots represent compounds generated by the VINA protocol, while the orange dots represent compounds generated by the IFPCS one.
FIGURE 14
FIGURE 14
The ability of the two Autogrow protocols in the prospective de novo run to produce compounds that have a high degree of similarity with regard to shape and electrostatic properties to the crystallographic ligands, chosen as reference. The probability distribution of the ET combo score for compounds populating each generation is reported as a histogram, where the vertical axis reports the probability density while the horizontal axis reports the ET combo value. Two distributions are reported within each plot: the blue bars refer to compounds generated with the VINA protocol, while the orange bars refer to compounds generated with the IFPCS one.
FIGURE 15
FIGURE 15
The capability of the two different Autogrow protocols in the prospective de novo run to produce compounds that have a high degree of similarity concerning shape and electrostatic properties to the crystallographic ligands, chosen as reference. For each generation, the percentage of compounds within the total population whose ET combo exceeds a defined threshold value is reported. Three different cutoff values are reported: 0.50, 0.75, and 1.00, respectively.
FIGURE 16
FIGURE 16
The superposition between the docking-predicted binding mode of a high-scoring compound (MMS3) from the benchmark de novo run performed with the IFPCS scoring protocol and the reference crystal binding pose of compound PFO from the structure deposited in the Protein Data Bank with accession code 4TN6. On the left part of the image, the protein kinase CK1δ ATP binding site is reported in teal ribbon, the pose of the compound MMS3 is shown as orange sticks, while the pose of compound PFO is shown in green sticks. On the right part of the image, the chemical structure of the compound MMS3 is reported.

Similar articles

Cited by

References

    1. AutoGrow4 (2020). AutoGrow4 – Durrant Lab. Available at: https://durrantlab.pitt.edu/autogrow4/ .
    1. Behrend L., Stöter M., Kurth M., Rutter G., Heukeshoven J., Deppert W., et al. (2000). Interaction of Casein Kinase 1 Delta (CK1δ) with Post-golgi Structures, Microtubules and the Spindle Apparatus. Eur. J. Cell. Biol. 79, 240–251. 10.1078/s0171-9335(04)70027-8 - DOI - PubMed
    1. Berman H. M., Westbrook J., Feng Z., Gilliland G., Bhat T. N., Weissig H., et al. (2000). The Protein Data Bank. Nucleic Acids Res. 28, 235–242. 10.1093/nar/28.1.235 - DOI - PMC - PubMed
    1. Bischof J., Randoll S.-J., Süßner N., Henne-Bruns D., Pinna L. A., Knippschild U. (2013). CK1δ Kinase Activity Is Modulated by Chk1-Mediated Phosphorylation. PLoS ONE 8, e68803. 10.1371/journal.pone.0068803 - DOI - PMC - PubMed
    1. Bissaro M., Sturlese M., Moro S. (2020). The Rise of Molecular Simulations in Fragment-Based Drug Design (FBDD): an Overview. Drug Discov. Today 25, 1693–1701. 10.1016/j.drudis.2020.06.023 - DOI - PMC - PubMed