

Benchmarking of ATAC Sequencing Data From BGI's Low-Cost DNBSEQ-G400 Instrument for Identification of Open and Occupied Chromatin Regions
- PMID: 35874611
- PMCID: PMC9302965
- DOI: 10.3389/fmolb.2022.900323
Benchmarking of ATAC Sequencing Data From BGI's Low-Cost DNBSEQ-G400 Instrument for Identification of Open and Occupied Chromatin Regions
Abstract
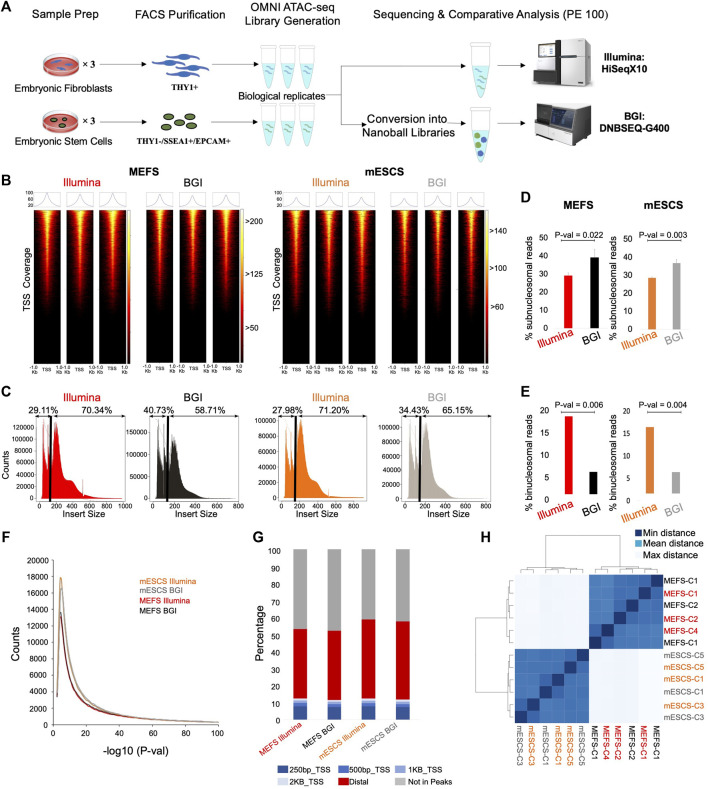
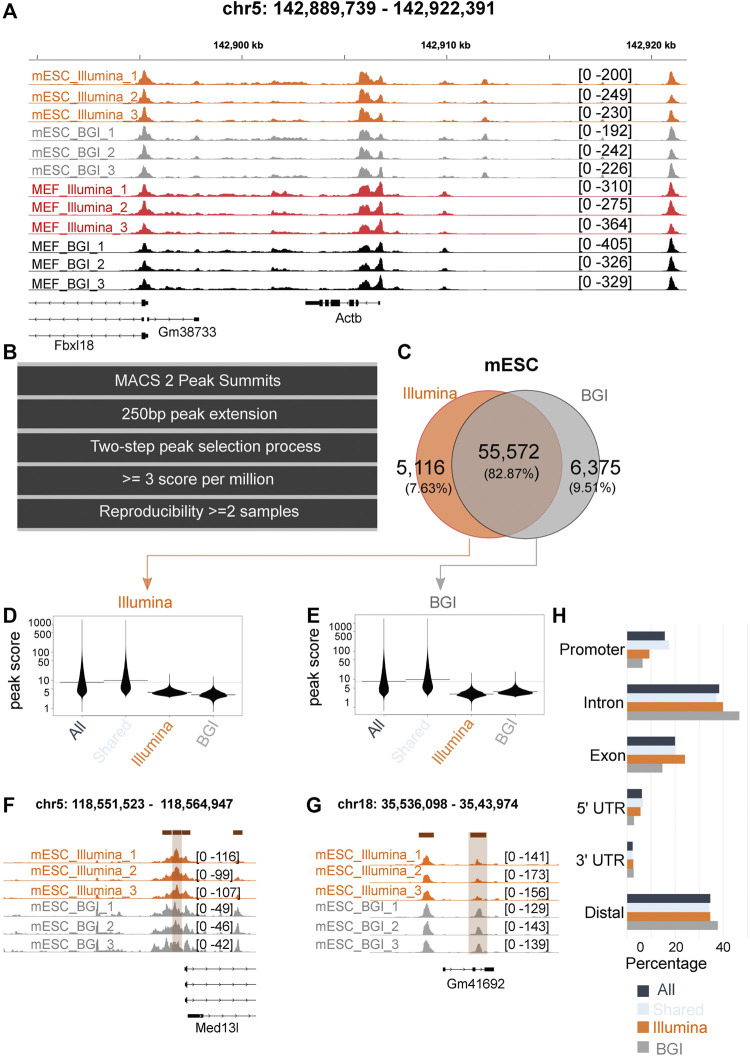
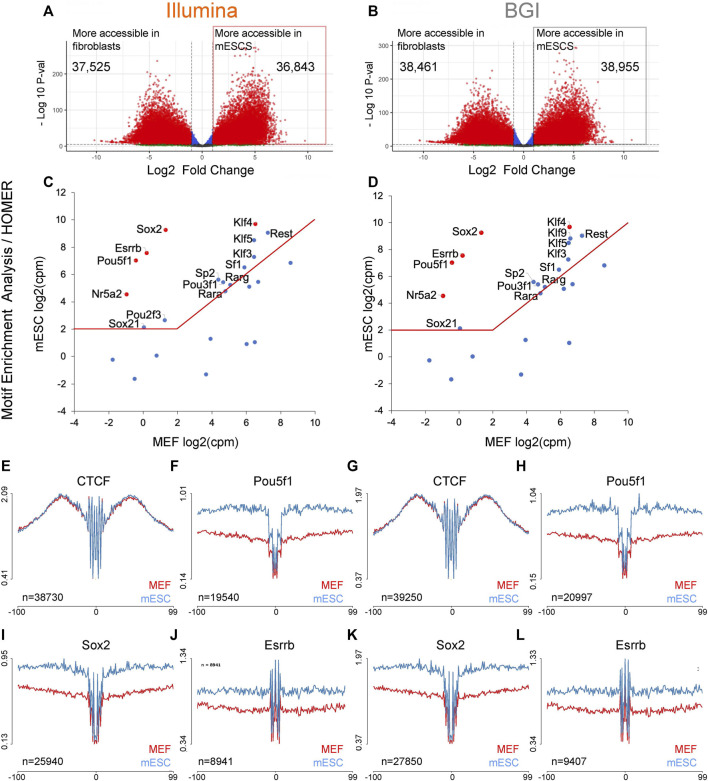
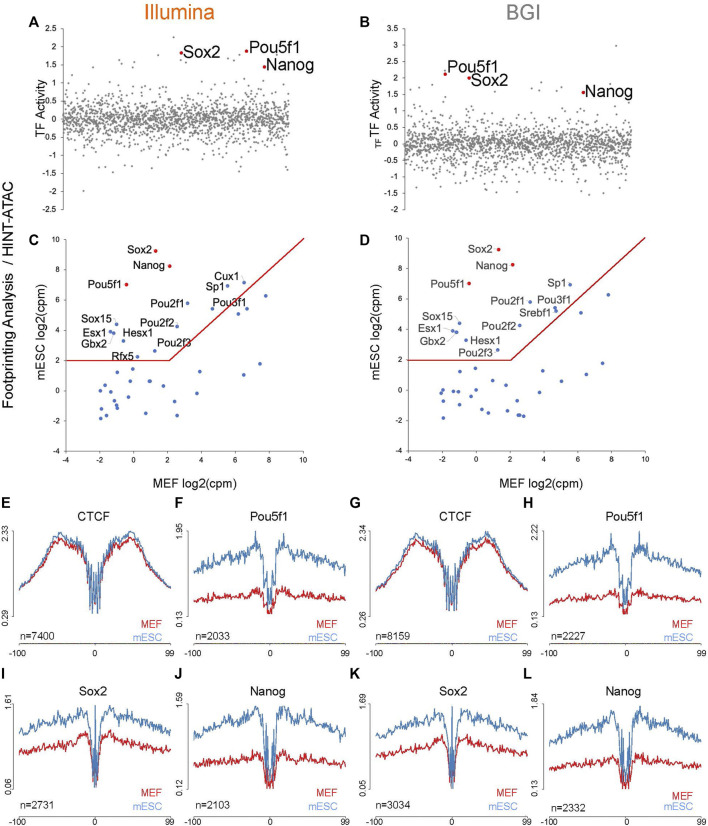
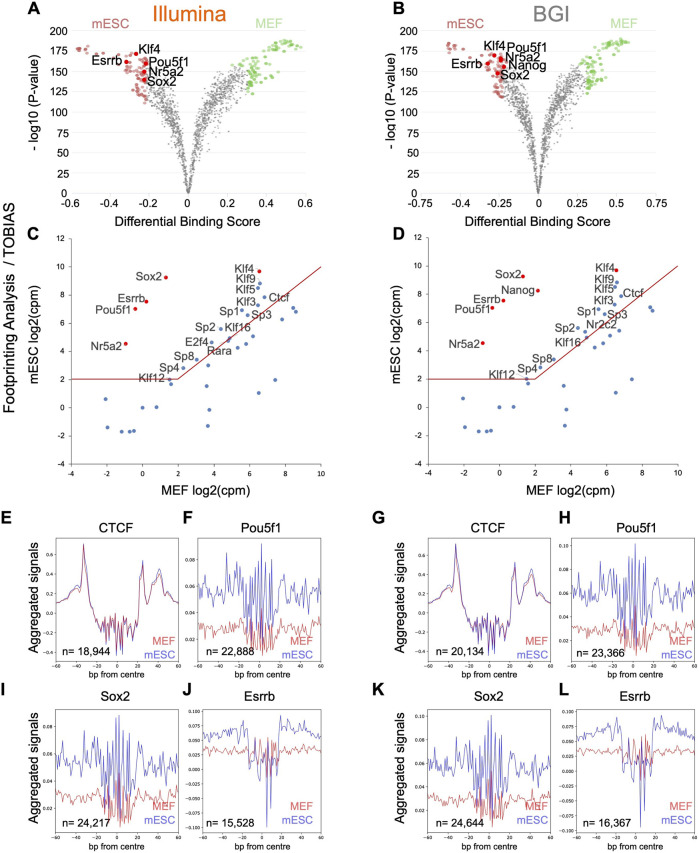
Background: Chromatin falls into one of two major subtypes: closed heterochromatin and euchromatin which is accessible, transcriptionally active, and occupied by transcription factors (TFs). The most widely used approach to interrogate differences in the chromatin state landscape is the Assay for Transposase-Accessible Chromatin using sequencing (ATAC-seq). While library generation is relatively inexpensive, sequencing depth requirements can make this assay cost-prohibitive for some laboratories. Findings: Here, we benchmark data from Beijing Genomics Institute's (BGI) DNBSEQ-G400 low-cost sequencer against data from a standard Illumina instrument (HiSeqX10). For comparisons, the same bulk ATAC-seq libraries generated from pluripotent stem cells (PSCs) and fibroblasts were sequenced on both platforms. Both instruments generate sequencing reads with comparable mapping rates and genomic context. However, DNBSEQ-G400 data contained a significantly higher number of small, sub-nucleosomal reads (>30% increase) and a reduced number of bi-nucleosomal reads (>75% decrease), which resulted in narrower peak bases and improved peak calling, enabling the identification of 4% more differentially accessible regions between PSCs and fibroblasts. The ability to identify master TFs that underpin the PSC state relative to fibroblasts (via HOMER, HINT-ATAC, TOBIAS), namely, foot-printing capacity, were highly similar between data generated on both platforms. Integrative analysis with transcriptional data equally enabled direct recovery of three published 3-factor combinations that have been shown to induce pluripotency. Conclusion: Other than a small increase in peak calling sensitivity for DNBSEQ-G400 data (BGI), both platforms enable comparable levels of open chromatin identification for ATAC-seq library sequencing, yielding similar analytical outcomes, albeit at low-data generation costs in the case of the BGI instrument.
Keywords: ATAC-seq; BGI; DNBSEQ-G400; Illumina; benchmarking; foot-printing; motif enrichment; sequencing platform.
Copyright © 2022 Naval-Sanchez, Deshpande, Tran, Zhang, Alhomrani, Alsanie, Nguyen and Nefzger.
Conflict of interest statement
The authors declare that the research was conducted in the absence of any commercial or financial relationships that could be construed as a potential conflict of interest.
Figures
Similar articles
-
Efficient and stable metabarcoding sequencing data using a DNBSEQ-G400 sequencer validated by comprehensive community analyses.GigaByte. 2021 Mar 23;2021:gigabyte16. doi: 10.46471/gigabyte.16. eCollection 2021. GigaByte. 2021. PMID: 36824325 Free PMC article.
-
Hydrop enables droplet-based single-cell ATAC-seq and single-cell RNA-seq using dissolvable hydrogel beads.Elife. 2022 Feb 23;11:e73971. doi: 10.7554/eLife.73971. Elife. 2022. PMID: 35195064 Free PMC article.
-
ATAC-STARR-seq reveals transcription factor-bound activators and silencers within chromatin-accessible regions of the human genome.Genome Res. 2022 Aug 25;32(8):1529-1541. doi: 10.1101/gr.276766.122. Genome Res. 2022. PMID: 35858748 Free PMC article.
-
Interrogating the Accessible Chromatin Landscape of Eukaryote Genomes Using ATAC-seq.Methods Mol Biol. 2021;2243:183-226. doi: 10.1007/978-1-0716-1103-6_10. Methods Mol Biol. 2021. PMID: 33606259 Review.
-
From reads to insight: a hitchhiker's guide to ATAC-seq data analysis.Genome Biol. 2020 Feb 3;21(1):22. doi: 10.1186/s13059-020-1929-3. Genome Biol. 2020. PMID: 32014034 Free PMC article. Review.
Cited by
-
Genome Sequencing of the Antibiotic-Resistant Leucobacter sp. HNU-1 and Its Developmental Toxicity in Caenorhabditis elegans.Int J Mol Sci. 2025 Apr 13;26(8):3673. doi: 10.3390/ijms26083673. Int J Mol Sci. 2025. PMID: 40338253 Free PMC article.
-
Comparison of the DNBSEQ platform and Illumina HiSeq 2000 for bacterial genome assembly.Sci Rep. 2024 Jan 14;14(1):1292. doi: 10.1038/s41598-024-51725-0. Sci Rep. 2024. PMID: 38221534 Free PMC article.
-
Structural variant and nucleosome occupancy dynamics postchemotherapy in a HER2+ breast cancer organoid model.Proc Natl Acad Sci U S A. 2025 Mar 4;122(9):e2415475122. doi: 10.1073/pnas.2415475122. Epub 2025 Feb 24. Proc Natl Acad Sci U S A. 2025. PMID: 39993200 Free PMC article.
-
High-throughput sequencing: a breakthrough in molecular diagnosis for precision medicine.Funct Integr Genomics. 2025 Jan 22;25(1):22. doi: 10.1007/s10142-025-01529-w. Funct Integr Genomics. 2025. PMID: 39838192 Review.
References
-
- Alexandre P. A., Naval-Sánchez M., Menzies M., Nguyen L. T., Porto-Neto L. R., Fortes M. R. S., et al. (2021). Chromatin Accessibility and Regulatory Vocabulary across Indicine Cattle Tissues. Genome Biol. 22, 273. 10.1186/s13059-021-02489-7 PubMed Abstract | 10.1186/s13059-021-02489-7 | Google Scholar - DOI - DOI - PMC - PubMed
-
- Amemiya H. M., Kundaje A., Boyle A. P. (2019). The ENCODE Blacklist: Identification of Problematic Regions of the Genome. Sci. Rep. 9 (1), 1–5. 10.1038/s41598-019-45839-z PubMed Abstract | 10.1038/s41598-019-45839-z | Google Scholar - DOI - DOI - PMC - PubMed
-
- Bentsen M., Goymann P., Schultheis H., Klee K., Petrova A., Wiegandt R., et al. (2020). ATAC-seq Footprinting Unravels Kinetics of Transcription Factor Binding during Zygotic Genome Activation. Nat. Commun. 11 (1), 4267. 10.1038/s41467-020-18035-1 PubMed Abstract | 10.1038/s41467-020-18035-1 | Google Scholar - DOI - DOI - PMC - PubMed
-
- Buenrostro J. D., Giresi P. G., Zaba L. C., Chang H. Y., Greenleaf W. J. (2013). Transposition of Native Chromatin for Fast and Sensitive Epigenomic Profiling of Open Chromatin, DNA-Binding Proteins and Nucleosome Position. Nat. Methods 10 (12), 1213–1218. 10.1038/nmeth.2688 PubMed Abstract | 10.1038/nmeth.2688 | Google Scholar - DOI - DOI - PMC - PubMed
-
- Chen J., Nefzger C. M., Rossello F. J., Sun Y. B. Y., Lim S. M., Liu X., et al. (2018). Fine Tuning of Canonical Wnt Stimulation Enhances Differentiation of Pluripotent Stem Cells Independent of β-Catenin-Mediated T-Cell Factor Signaling. Stem Cells Dayt. Ohio 36 (6), 822–833. 10.1002/stem.2794 PubMed Abstract | 10.1002/stem.2794 | Google Scholar - DOI - DOI - PubMed
LinkOut - more resources
Full Text Sources
Molecular Biology Databases