. 2022 Jul 8:13:910526.
doi: 10.3389/fimmu.2022.910526. eCollection 2022.

SerpinB3 as a Pro-Inflammatory Mediator in the Progression of Experimental Non-Alcoholic Fatty Liver Disease

Affiliations

SerpinB3 as a Pro-Inflammatory Mediator in the Progression of Experimental Non-Alcoholic Fatty Liver Disease

Erica Novo et al. Front Immunol. .

Abstract

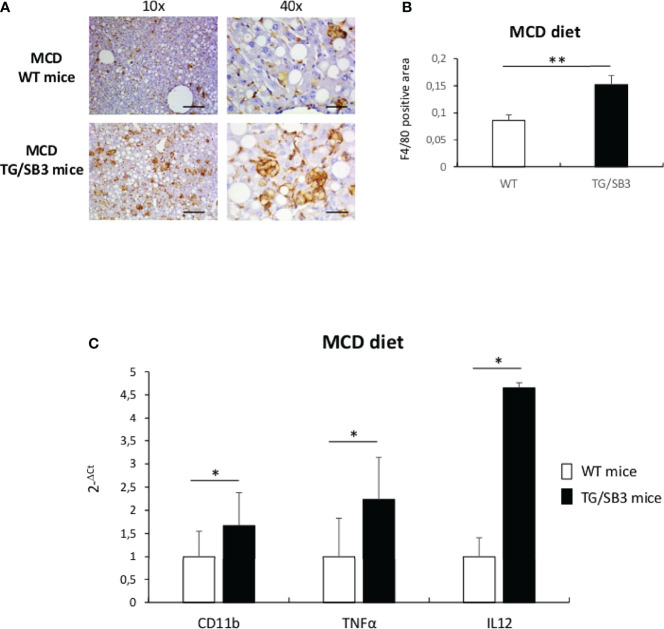
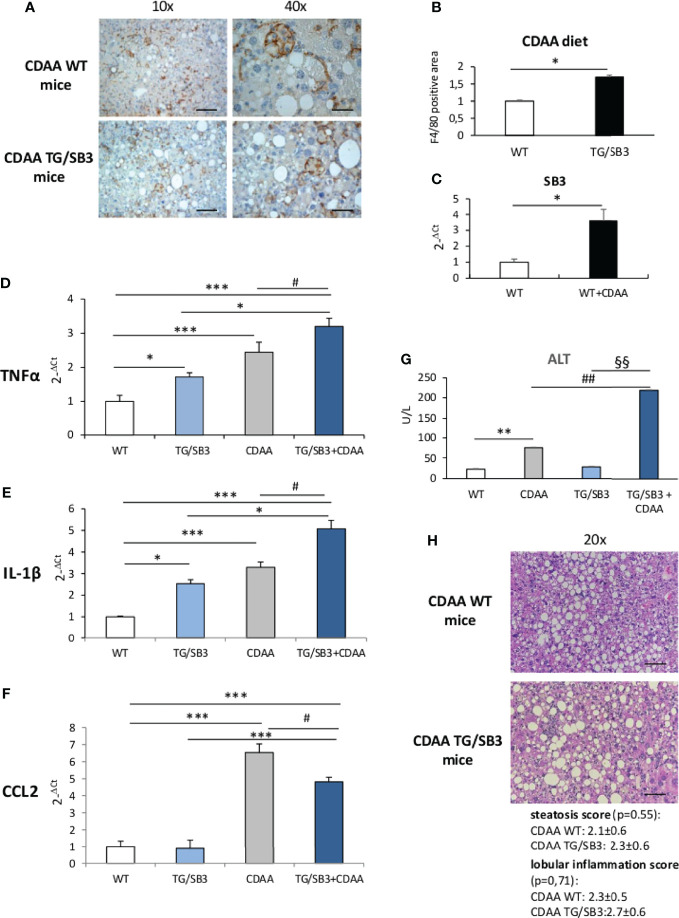
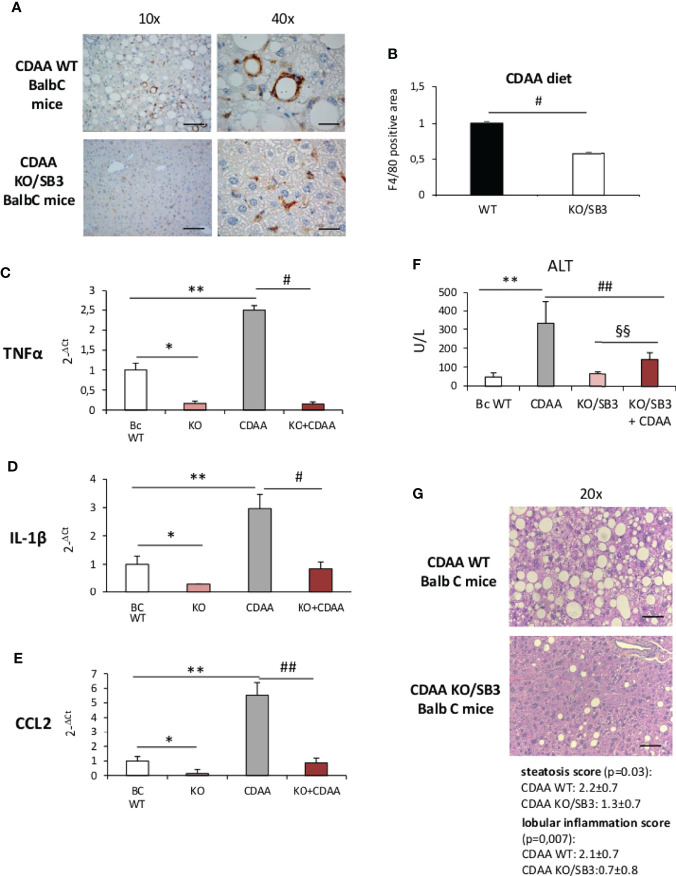
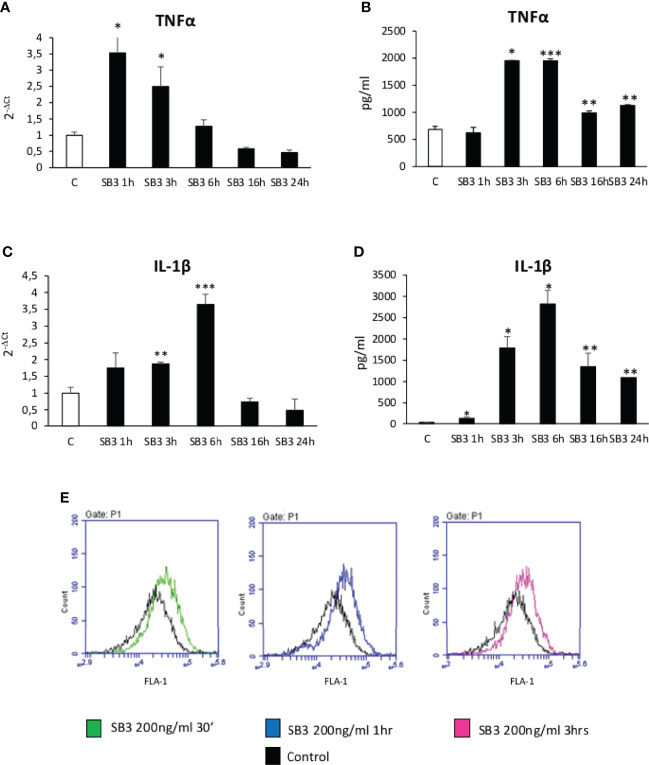
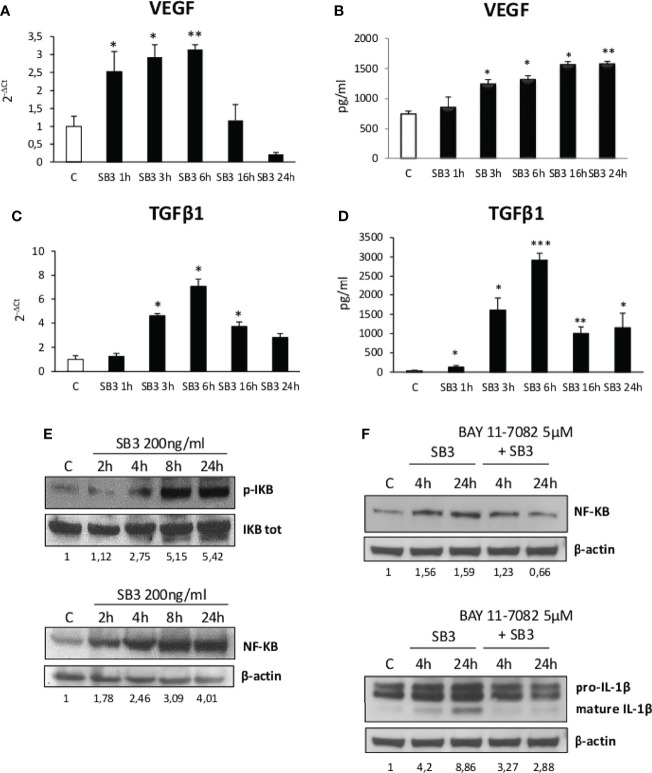
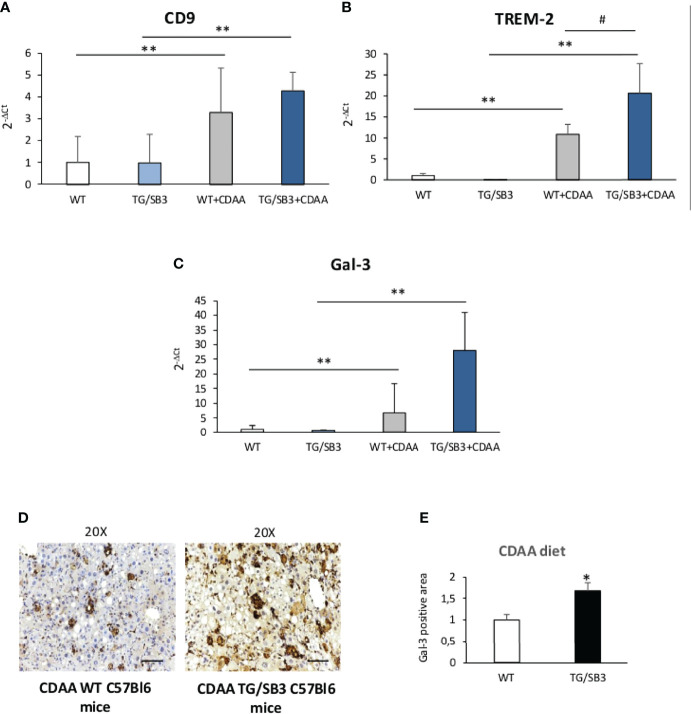
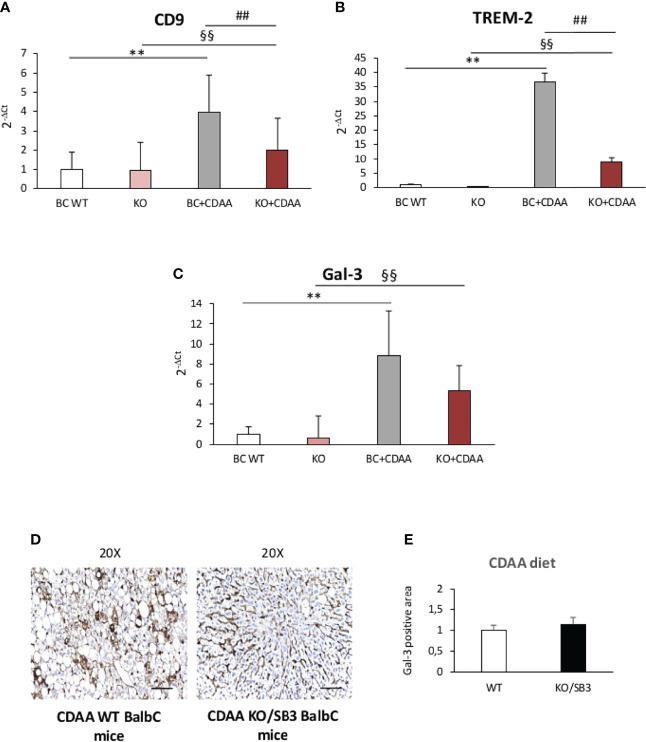
Non-alcoholic fatty liver disease (NAFLD) is becoming the most common chronic liver disease worldwide. In 20-30% of patients, NAFLD can progress into non-alcoholic steatohepatitis (NASH), eventually leading to fibrosis, cirrhosis and hepatocellular carcinoma development. SerpinB3 (SB3), a hypoxia-inducible factor-2α dependent cysteine protease inhibitor, is up-regulated in hepatocytes during progressive NAFLD and proposed to contribute to disease progression. In this study we investigated the pro-inflammatory role of SB3 by employing phorbol-myristate acetate-differentiated human THP-1 macrophages exposed in vitro to human recombinant SB3 (hrSB3) along with mice overexpressing SB3 in hepatocytes (TG/SB3) or knockout for SB3 (KO/SB3) in which NASH was induced by feeding methionine/choline deficient (MCD) or a choline-deficient, L-amino acid defined (CDAA) diets. In vivo experiments showed that the induction of NASH in TG/SB3 mice was characterized by an impressive increase of liver infiltrating macrophages that formed crown-like aggregates and by an up-regulation of hepatic transcript levels of pro-inflammatory cytokines. All these parameters and the extent of liver damage were significantly blunted in KO/SB3 mice. In vitro experiments confirmed that hrSB3 stimulated macrophage production of M1-cytokines such as TNFα and IL-1β and reactive oxygen species along with that of TGFβ and VEGF through the activation of the NF-kB transcription factor. The opposite changes in liver macrophage activation observed in TG/SB3 or KO/SB3 mice with NASH were associated with a parallel modulation in the expression of triggering receptor expressed on myeloid cells-2 (TREM2), CD9 and galectin-3 markers, recently detected in NASH-associated macrophages. From these results we propose that SB3, produced by activated/injured hepatocytes, may operate as a pro-inflammatory mediator in NASH contributing to the disease progression.

Keywords: NASH; SerpinB3; hepatocytes; innate immunity; macrophages.


Conflict of interest statement

The authors declare that the research was conducted in the absence of any commercial or financial relationships that could be construed as a potential conflict of interest.

Figures

Figure 1
Figure 1
(A–C) (A) Immunoistochemistry analysis for F4/80 on liver specimens obtained from C57Bl6J WT mice and C57Bl6J transgenic mice for SB3 (TG/SB3) fed on MCD diet for 8 weeks. Magnification 10x, scale bar 200µm, magnification 40x, scale bar 50µm. (B) ImageJ software analysis performed to evaluate the amount of F4/80 positive area in C57Bl6J WT mice and C57Bl6J transgenic mice for SB3 (TG/SB3) fed on MCD diet for 8 weeks. **p < 0.01 versus WT mice. (C) Quantitative real time PCR analysis of CD11b, TNFα and IL12 in C57Bl6J WT mice and transgenic mice for SB3 (TG/SB3) fed on MCD diet for 8 weeks. *p < 0.05 versus WT mice.
Figure 2
Figure 2
(A–H) (A) Immunohistochemistry analysis for F4/80 on liver specimens obtained from C57Bl6J WT mice and transgenic mice for SB3 (TG/SB3) fed on CDAA for 12 weeks. Magnification 10x, scale bar 200µm, magnification 40x, scale bar 50µm. (B) ImageJ software analysis performed to evaluate the amount of F4/80 positive area in C57Bl6J WT mice and transgenic mice for SB3 (TG/SB3) fed on CDAA for 12 weeks. *p < 0.05 versus WT mice. (C) Quantitative real time PCR analysis of SB3 in C57Bl6J WT mice fed on control (WT) or CDAA diet (WT+CDAA). *p < 0.05 versus WT mice. Quantitative real time PCR analysis of TNFα (D), IL-1β (E) and CCL2 (F) in C57Bl6J WT mice and transgenic mice for SB3 (TG/SB3) fed on control CSAA diet (WT and TG/SB3) or CDAA diet for 12 weeks (CDAA and TG/SB3+CDAA). ***p < 0.001 and *p < 0.05 versus WT mice fed on control CSAA diet (WT) or versus TG/SB3 mice fed on CSAA diet; #p < 0.05 versus C57Bl6J WT mice fed on CDAA diet (CDAA). (G) Serum levels of alanine amino transferase (ALT) analyzed as a parameter of parenchymal injury in C57Bl6J WT mice and transgenic mice for SB3 (TG/SB3) fed on control CSAA diet (WT and TG/SB3) or CDAA diet for 12 weeks (CDAA and TG/SB3+CDAA). **p < 0.01 versus WT mice fed on control CSAA diet (WT), ##p < 0.01 versus WT mice fed on CDAA diet, §§p < 0.01 versus TG/SB3 mice fed on CSAA diet. (H) Hematoxylin eosin staining and score of steatosis and lobular inflammation in WT e TG/SB3 mice fed on CDAA diet for 12 weeks to evaluate steatosis and inflammation. Magnification 20x, scale bar 100µm.
Figure 3
Figure 3
(A–G) (A) Immunohistochemistry analysis for F4/80 on liver specimens obtained from BalbC WT mice and knock out mice for SB3 (KO/SB3) fed on CDAA diet for 12 weeks. Magnification 10x, scale bar 200µm, magnification 40x, scale bar 50µm. (B) ImageJ software analysis performed to evaluate the amount of F4/80 positive area. #p < 0.05 versus BalbC control mice. Quantitative real time PCR analysis of TNFα (C), IL-1β (D) and CCL2 (E) in WT BalbC mice and knock out mice for SB3 (KO/SB3) fed on control CSAA diet (BC WT and KO) or CDAA diet for 12 weeks (CDAA and KO+CDAA). *p < 0.05, **p < 0.01 versus BalbC WT mice fed on control CSAA diet (BC WT); #p < 0.05 ##p < 0.01 versus BalbC WT mice fed on CDAA (CDAA). (F) Serum levels of alanine amino transferase (ALT) analyzed as a parameter of parenchymal injury in BalbC WT mice and knock out mice for SB3 (KO/SB3) fed on control CSAA diet (BC WT and KO/SB3) or CDAA diet for 12 weeks (CDAA and KO/SB3+CDAA). **p < 0.01 versus WT mice fed on control CSAA diet (BC WT), ##p < 0.01 versus BalbC WT mice fed on CDAA diet (CDAA), §§ p < 0.01 versus KO/SB3 mice fed on CSAA diet. (G) Hematoxylin eosin staining and score of steatosis and lobular inflammation in WT e KO/SB3 mice fed on CDAA diet for 12 weeks to evaluate steatosis and inflammation. Magnification 20x, scale bar 100µm.
Figure 4
Figure 4
(A–E) Time course analysis of transcript levels by quantitative real time PCR (A, C) as well as of protein levels by ELISA (B, D) of TNFα and IL-1β in human differentiated THP1 cells exposed or not to hrSB3 200ng/ml (SB3) up to 24 hours. *p < 0.05, **p < 0.01, ***p < 0.001 versus control cells. (E) DCFH-DA fluorescence in flow cytometry analysis to detect intracellular generation of reactive oxygen species induced by exposure of cells to hrSB3 200ng/ml for the indicated time points.
Figure 5
Figure 5
(A–F) Time course analysis of transcript levels by quantitative real time PCR (A, C) as well as of protein levels by ELISA (B, D) of VEGF and TGFβ1 in human differentiated THP1 cells exposed or not to hrSB3 200ng/ml (SB3) up to 24 hours. *p < 0.05, **p < 0.01, ***p < 0.001 versus control cells. (E) Western blotting analysis of phosphorylated IKB and of protein levels of NF-kB in human differentiated THP-1 cells exposed or not to hrSB3 200ng/ml (starting from 2 hrs up to 24 hrs). Equal loading was confirmed by re-probing the same membrane with the un phosphorylated protein IKB or with β-actin. Values obtained from band densitometry analysis, using ImageJ software, are reported. (F) Western blot analysis of protein levels of NFkB and IL-1β in human THP-1 cells exposed to hrSB3 200ng/ml for 4 and 24 hrs or pre-treated with the inhibitor of IKK protein, BAY 11-7082 5µM and then exposed to hrSB3 200ng/ml for 4hrs and 24 hrs. Equal loading was confirmed by re-probing the same membrane with β-actin. Values obtained from band densitometry analysis, using ImageJ software, are reported.
Figure 6
Figure 6
(A–E) Quantitative real time PCR analysis of CD9, (A) TREM-2 (B) and Gal-3 (C) in control C57Bl6J mice and transgenic mice for SB3 fed on control diet (WT and TG/SB3) or CDAA diet for 12 weeks (WT+CDAA and TG/SB3+CDAA). **p < 0.01 versus C57Bl6J control mice fed with control diet (WT) #p < 0.05 versus C57Bl6J control mice fed with CDAA (WT+CDAA). (D) Immunohistochemistry analysis for Gal-3 on liver specimens obtained from C57Bl6J WT mice and transgenic mice for SB3 (TG/SB3) fed on CDAA for 12 weeks. Magnification 20x, scale bar 100µm. (E) ImageJ software analysis was performed to evaluate the amount of Gal-3 positive area in C57Bl6J WT mice and transgenic mice for SB3 (TG/SB3) fed on CDAA for 12 weeks. *p < 0.05 versus WT mice.
Figure 7
Figure 7
(A–E) Quantitative real time PCR analysis of CD9, (A) TREM-2 (B) and Gal-3 (C) in control BalbC mice and knock out mice for SB3 fed on control diet (BC WT and KO) or CDAA diet for 12 weeks (BC+CDAA and KO+CDAA). **p < 0.01 versus BalbC control mice fed with control diet (BC WT); §§p < 0.01 versus BalbC control mice fed with control diet (KO), ##p < 0.01 versus BalbC control mice fed with CDAA diet (BC+CDAA). (D) Immunohistochemistry analysis for Gal-3 in liver specimens obtained from WT BalbC mice and KO/SB3 BalbC mice fed on CDAA diet for 12 weeks. Magnification 20x, scale bar 100µm. (E) ImageJ software analysis was performed to evaluate the amount of Gal-3 positive area in BalbC WT mice and knock out mice for SB3 (KO/SB3) fed on CDAA for 12 weeks.

Similar articles

Cited by

References

    1. Kanwal F, Shubrook JH, Younossi Z, Natarajan Y, Bugianesi E, Rinella ME, et al. . Preparing for the NASH Epidemic: A Call to Action. Gastroenterology (2021) 161:1030–42. doi: 10.1053/j.gastro.2021.04.074 - DOI - PubMed
    1. Younossi Z, Tacke F, Arrese M, Chander Sharma B, Mostafa I, Bugianesi E, et al. . Global Perspectives on Nonalcoholic Fatty Liver Disease and Nonalcoholic Steatohepatitis. Hepatology (2019) 69:2672–82. doi: 10.1002/hep.30251 - DOI - PubMed
    1. Younossi Z, Anstee QM, Marietti M, Hardy T, Henry L, Eslam M, et al. . Global Burden of NAFLD and NASH: Trends, Predictions, Risk Factors and Prevention. Nat Rev Gastroenterol Hepatol (2018) 15:11–20. doi: 10.1038/nrgastro.2017.109 - DOI - PubMed
    1. McPherson S, Hardy T, Henderson E, Burt AD, Day CP, Anstee QM. Evidence of NAFLD Progression From Steatosis to Fibrosing-Steatohepatitis Using Paired Biopsies: Implications for Prognosis and Clinical Management. J Hepatol (2015) 62:1148–55. doi: 10.1016/j.jhep.2014.11.034 - DOI - PubMed
    1. Younossi ZM, Golabi P, de Avila L, Minhui Paik J, Srishord M, Fukui N, et al. . The Global Epidemiology of NAFLD and NASH in Patients With Type 2 Diabetes: A Systematic Review and Meta-Analysis. J Hepatol (2019) 71:793–801. doi: 10.1016/j.jhep.2019.06.021 - DOI - PubMed

Publication types