

TGF-β Enhances Immunosuppression of Myeloid-Derived Suppressor Cells to Induce Transplant Immune Tolerance Through Affecting Arg-1 Expression
- PMID: 35874674
- PMCID: PMC9300822
- DOI: 10.3389/fimmu.2022.919674
TGF-β Enhances Immunosuppression of Myeloid-Derived Suppressor Cells to Induce Transplant Immune Tolerance Through Affecting Arg-1 Expression
Abstract
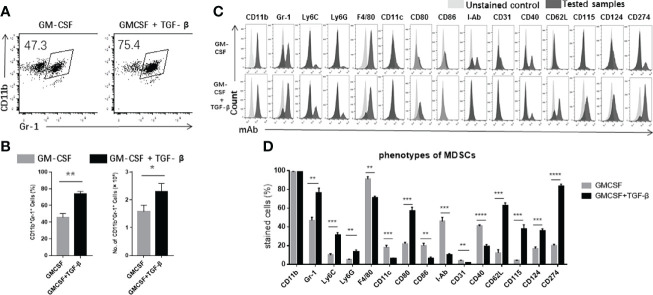
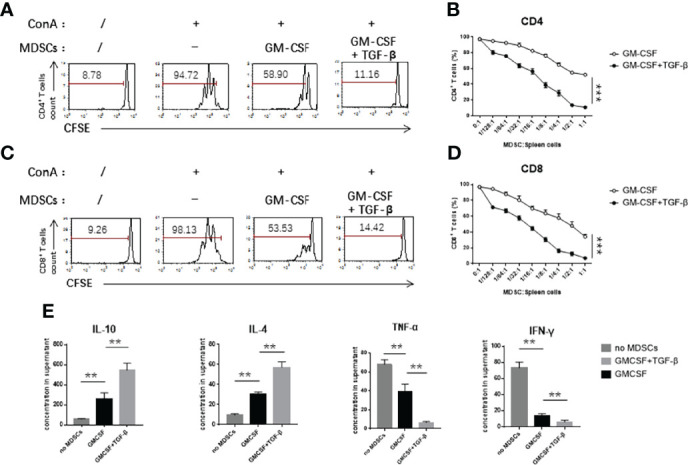
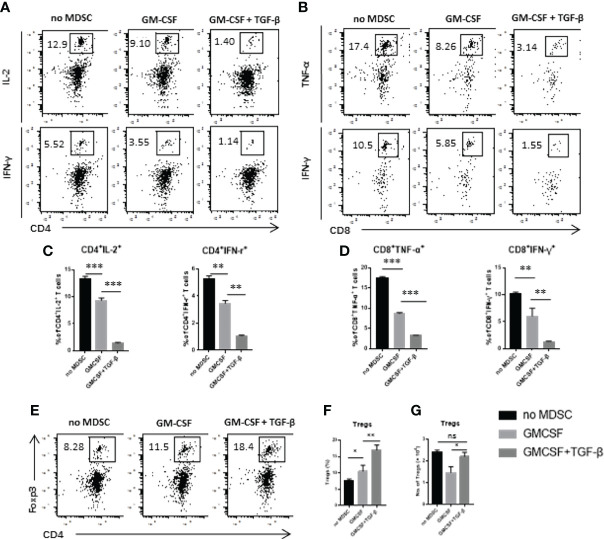
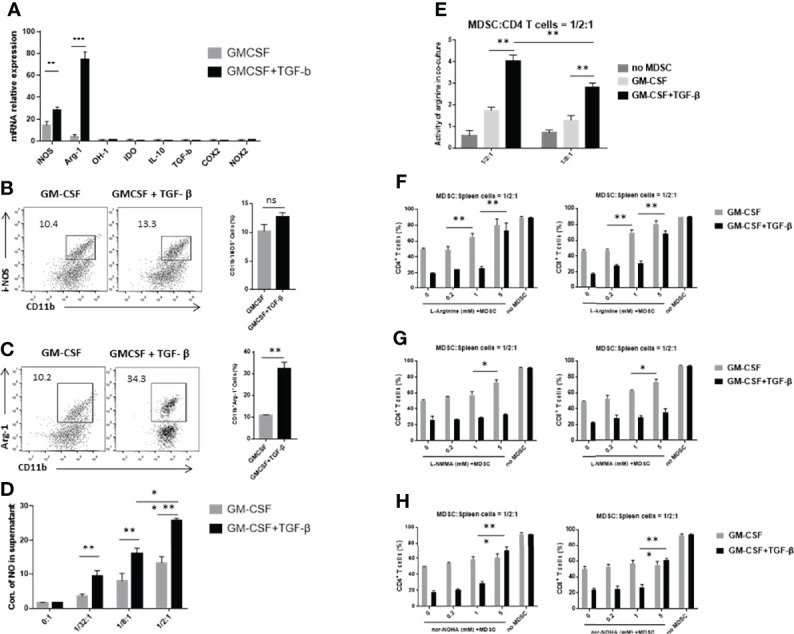
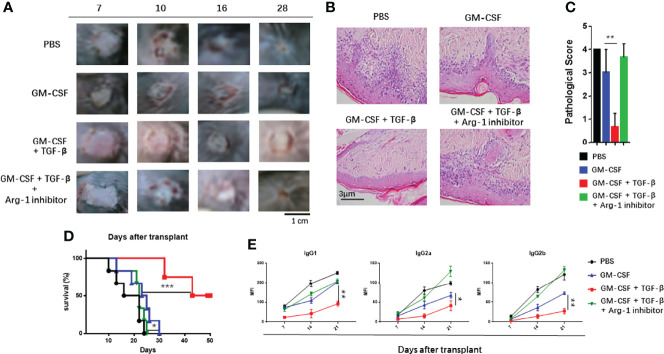
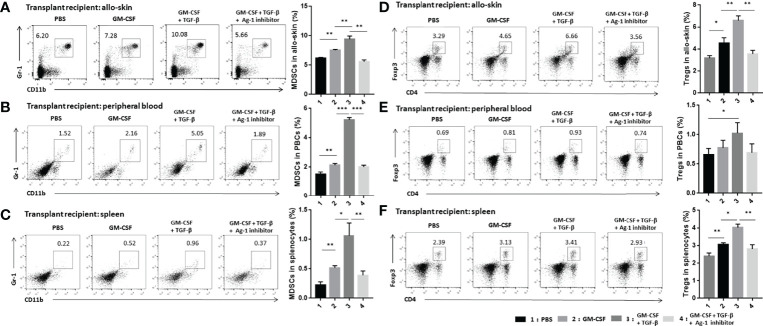
Myeloid-derived suppressor cells (MDSCs) are a class of heterogeneous myeloid cells, which play an important role in immunosuppression. We intended to find an effective method that can produce MDSCs with significantly better efficiency and promote immune tolerance for transplant rejection through cell therapy. It has been reported that granulocyte and macrophage colony-stimulating factor (GM-CSF) could induce MDSCs in vitro to cause immunosuppression. In the present study, transforming growth factor β (TGF-β) was added to the induction system, and flow cytometry analysis was used to detect the phenotypes of induced MDSCs. Their potential immunosuppressive function and mechanisms were determined by co-culturing MDSCs with stimulated T cells in vitro and transferring MDSCs to the skin grafted C57BL/6J mouse models in vivo. It was found that the addition of TGF-β could effectively cause bone marrow cells to differentiate into a group of cells with stronger immunosuppressive functions, thereby inhibiting the proliferation of stimulated T cells. The population of CD11b+Gr-1+ MDSCs also increased significantly as compared with GM-CSF alone treatment. While detecting for immunosuppressive effectors, we found that expression of arginase 1 (Arg-1) was significantly upregulated in these MDSCs, and inhibitor of Arg-1 significantly suppressed their immunosuppressive capabilities. Moreover, an adoptive transfer of these cells significantly prolonged survival of allo-skin and improved immune tolerance in vivo. These findings indicated that TGF-β + GM-CSF could serve as an effective and feasible method to induce powerful immunosuppressive MDSCs in vitro. Thus, TGF-β + GM-CSF-induced MDSCs may have a promising role in prevention of the graft rejection.
Keywords: ARG-1; Immune rejection; TGF-β; immune tolerance; myeloid derived suppressor cells (MDSCs); transplant.
Copyright © 2022 Cao, Sun, Zhang, Zhang, Zheng, Yu, Zhao, Wang and Wang.
Conflict of interest statement
The authors declare that the research was conducted in the absence of any commercial or financial relationships that could be construed as a potential conflict of interest.
Figures
Similar articles
-
Bexarotene Induce Differentiation of Myeloid-Derived Suppressor Cells through Arg-1 Signalling Pathway.Transplant Proc. 2024 Jul-Aug;56(6):1469-1477. doi: 10.1016/j.transproceed.2024.03.043. Epub 2024 Jul 8. Transplant Proc. 2024. PMID: 38981763
-
The impact of cytokines and tumour-conditioned medium on the properties of murine in vitro generated myeloid-derived suppressor cells.Scand J Immunol. 2025 Feb;101(2):e70001. doi: 10.1111/sji.70001. Scand J Immunol. 2025. PMID: 39865924
-
Dexamethasone-Induced Myeloid-Derived Suppressor Cells Prolong Allo Cardiac Graft Survival through iNOS- and Glucocorticoid Receptor-Dependent Mechanism.Front Immunol. 2018 Feb 15;9:282. doi: 10.3389/fimmu.2018.00282. eCollection 2018. Front Immunol. 2018. PMID: 29497426 Free PMC article.
-
Correlation between MDSC and Immune Tolerance in Transplantation: Cytokines, Pathways and Cell-cell Interaction.Curr Gene Ther. 2019;19(2):81-92. doi: 10.2174/1566523219666190618093707. Curr Gene Ther. 2019. PMID: 31237207 Review.
-
Myeloid-derived suppressor cells in transplantation tolerance induction.Int Immunopharmacol. 2020 Jun;83:106421. doi: 10.1016/j.intimp.2020.106421. Epub 2020 Mar 24. Int Immunopharmacol. 2020. PMID: 32217462 Review.
Cited by
-
Negative Vaccination Strategies for Promotion of Transplant Tolerance.Transplantation. 2024 Aug 1;108(8):1715-1729. doi: 10.1097/TP.0000000000004911. Epub 2024 Feb 16. Transplantation. 2024. PMID: 38361234 Free PMC article. Review.
-
Cell-based immunotherapies for solid tumors: advances, challenges, and future directions.Front Oncol. 2025 Apr 28;15:1551583. doi: 10.3389/fonc.2025.1551583. eCollection 2025. Front Oncol. 2025. PMID: 40356763 Free PMC article. Review.
-
Mechanisms of myeloid-derived suppressor cell-mediated immunosuppression in colorectal cancer and related therapies.World J Gastrointest Oncol. 2024 May 15;16(5):1690-1704. doi: 10.4251/wjgo.v16.i5.1690. World J Gastrointest Oncol. 2024. PMID: 38764816 Free PMC article. Review.
-
Tumor-derived GLI1 promotes remodeling of the immune tumor microenvironment in melanoma.J Exp Clin Cancer Res. 2024 Aug 2;43(1):214. doi: 10.1186/s13046-024-03138-0. J Exp Clin Cancer Res. 2024. PMID: 39090759 Free PMC article.
-
Therapeutic targeting of TGF-β in lung cancer.FEBS J. 2025 Apr;292(7):1520-1557. doi: 10.1111/febs.17234. Epub 2024 Jul 31. FEBS J. 2025. PMID: 39083441 Free PMC article. Review.
References
-
- Fleming TJ, ML F, Malek TR. Selective Expression of Ly-6G on Myeloid Lineage Cells in Mouse Bone Marrow. RB6-8c5 mAb to Granulocyte-Differentiation Antigen (Gr-1) Detects Members of the Ly-6 Family. J Immunol (Baltimore Md 1950) (1993) 151(5):2399–408. - PubMed
Publication types
MeSH terms
Substances
LinkOut - more resources
Full Text Sources
Research Materials
Miscellaneous