

The Alternative Pathway Is Necessary and Sufficient for Complement Activation by Anti-THSD7A Autoantibodies, Which Are Predominantly IgG4 in Membranous Nephropathy
- PMID: 35874690
- PMCID: PMC9301376
- DOI: 10.3389/fimmu.2022.952235
The Alternative Pathway Is Necessary and Sufficient for Complement Activation by Anti-THSD7A Autoantibodies, Which Are Predominantly IgG4 in Membranous Nephropathy
Abstract
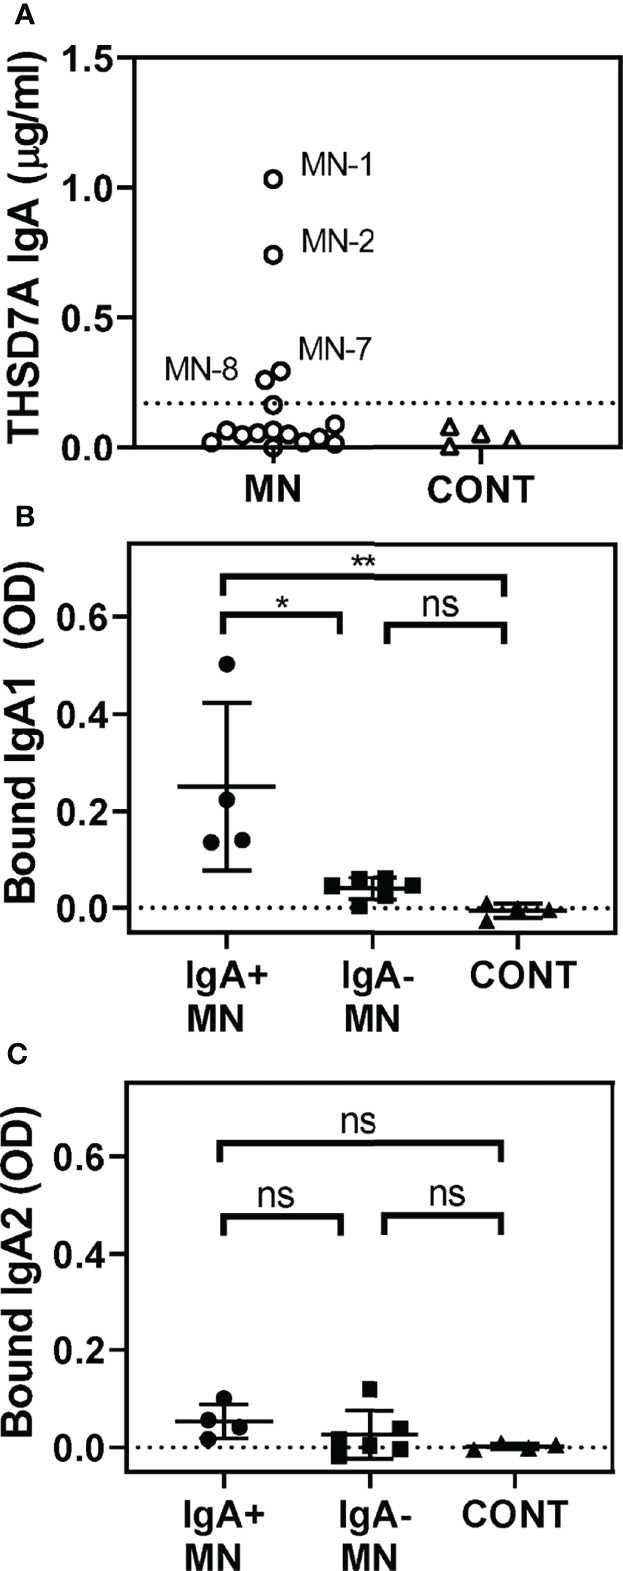
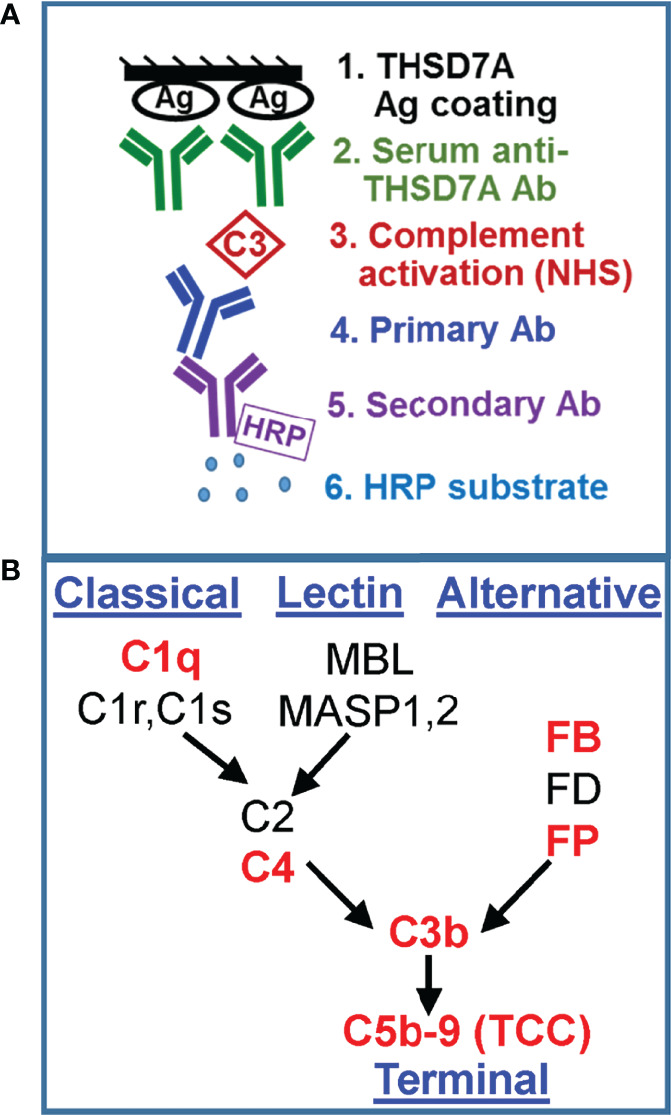
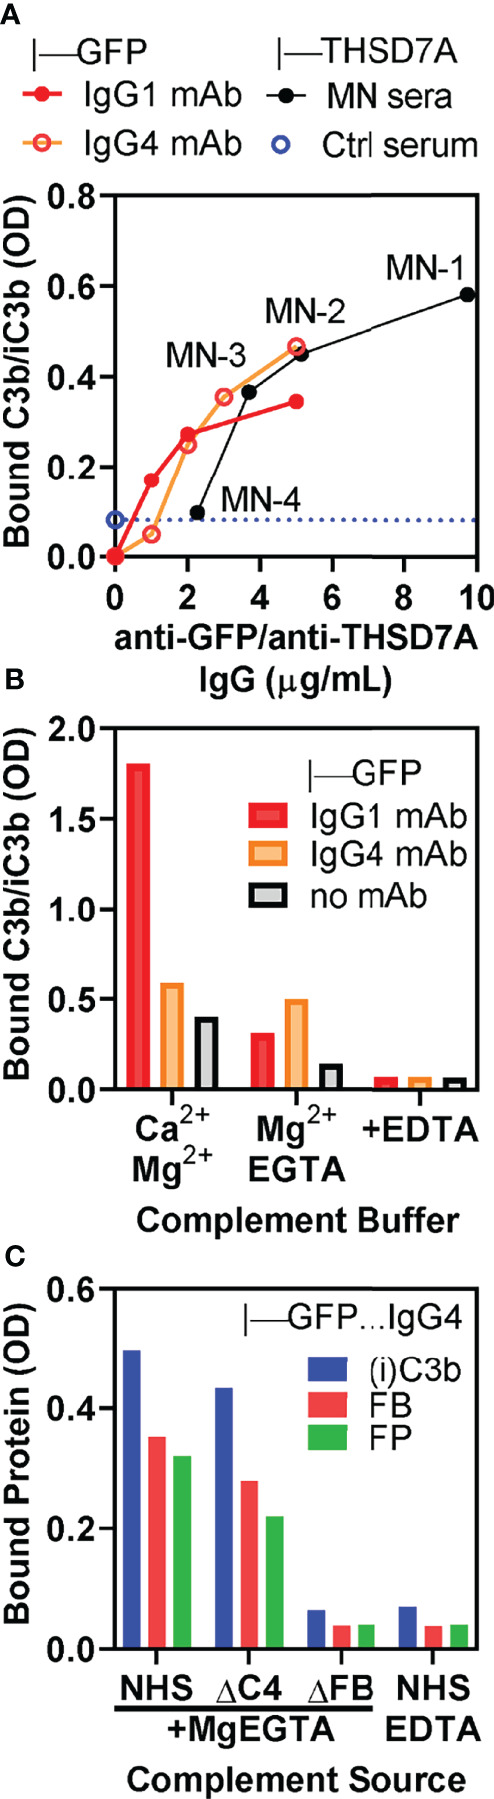
Membranous nephropathy (MN) is an immune kidney disease characterized by glomerular subepithelial immune complexes (ICs) containing antigen, IgG, and products of complement activation. Whereas proteinuria is caused by complement-mediated podocyte injury, the pathways of complement activation remain controversial due to the predominance of IgG4 in ICs, an IgG subclass considered unable to activate complement. THSD7A, a transmembrane protein expressed on podocytes, is the target autoantigen in ~3% of cases of primary MN. In this study, we analyzed sera from 16 patients with THSD7A-associated MN with regard to the anti-THSD7A IgG subclasses and their ability to fix complement in vitro. The serum concentration of anti-THSD7A IgG varied over two orders of magnitude (1.3-243 μg/mL). As a relative proportion of all IgG anti-THSD7A, IgG4 was by far the most abundant subclass (median 79%), followed by IgG1 (median 11%). IgG4 was the dominant subclass of anti-THSD7A antibodies in 14 sera, while IgG1 was dominant in one and co-dominant in another. One quarter of MN sera additionally contained low levels of anti-THSD7A IgA1. ICs formed by predominantly IgG4 anti-THSD7A autoantibodies with immobilized THSD7A were relatively weak activators of complement in vitro, compared to human IgG1 and IgG3 mAbs used as positive control. Complement deposition on THSD7A ICs was dose-dependent and occurred to a significant extent only at relatively high concentration of anti-THSD7A IgG. C3b fixation by THSD7A ICs was completely abolished in factor B-depleted sera, partially inhibited in C4-depleted sera, unchanged in C1q-depleted sera, and also occurred in Mg-EGTA buffer. These results imply that THSD7A ICs predominantly containing IgG4 activate complement at high IgG4 density, which strictly requires a functional alternative pathway, whereas the classical and lectin pathways are dispensable. These findings advance our understanding of how IgG4 antibodies activate complement.
Keywords: IgG4 antibodies; THSD7A (thrombospondin type 1 domain-containing protein 7A); alternative pathway of complement; complement activation; membranous nephropathy.
Copyright © 2022 Manral, Caza, Storey, Beck and Borza.
Conflict of interest statement
The authors declare a potential conflict of interest and state it below. LB reports being a co-inventor on the U.S. patent “Diagnostics for Membranous Nephropathy” and receives royalty income through Boston University. LB has served on advisory boards on the topic of MN and other glomerular diseases for Visterra, Ionis, Alexion, and Novartis, and receives royalties from UpToDate for topics related to MN. TC is employed by Arkana Laboratories, Little Rock, AR. The remaining authors declare that the research was conducted in the absence of any commercial or financial relationships that could be construed as a potential conflict of interest.
Figures


Similar articles
-
Antigen-Specific IgG Subclasses in Primary and Malignancy-Associated Membranous Nephropathy.Front Immunol. 2018 Dec 20;9:3035. doi: 10.3389/fimmu.2018.03035. eCollection 2018. Front Immunol. 2018. PMID: 30619370 Free PMC article.
-
Human anti-thrombospondin type 1 domain-containing 7A antibodies induce membranous nephropathy through activation of lectin complement pathway.Biosci Rep. 2018 Jun 21;38(3):BSR20180131. doi: 10.1042/BSR20180131. Print 2018 Jun 29. Biosci Rep. 2018. PMID: 29769410 Free PMC article.
-
Features of phospholipase A2 receptor and thrombospondin type-1 domain-containing 7A in malignancy-associated membranous nephropathy.J Clin Pathol. 2019 Oct;72(10):705-711. doi: 10.1136/jclinpath-2019-205852. Epub 2019 Jun 26. J Clin Pathol. 2019. PMID: 31243053
-
Unmet challenges in membranous nephropathy.Curr Opin Nephrol Hypertens. 2019 Jan;28(1):70-76. doi: 10.1097/MNH.0000000000000459. Curr Opin Nephrol Hypertens. 2019. PMID: 30451735 Free PMC article. Review.
-
Is primary membranous nephropathy a complement mediated disease?Mol Immunol. 2020 Dec;128:195-204. doi: 10.1016/j.molimm.2020.10.017. Epub 2020 Nov 1. Mol Immunol. 2020. PMID: 33142137 Review.
Cited by
-
The classical pathway triggers pathogenic complement activation in membranous nephropathy.Nat Commun. 2023 Jan 28;14(1):473. doi: 10.1038/s41467-023-36068-0. Nat Commun. 2023. PMID: 36709213 Free PMC article.
-
IgG4 glycosylation contributes to the pathogenesis of IgG4 Hashimoto's thyroiditis via the complement pathway.Eur Thyroid J. 2024 Oct 24;13(5):e240156. doi: 10.1530/ETJ-24-0156. Print 2024 Oct 1. Eur Thyroid J. 2024. PMID: 39316722 Free PMC article.
-
Fc effector of anti-Aβ antibody induces synapse loss and cognitive deficits in Alzheimer's disease-like mouse model.Signal Transduct Target Ther. 2023 Jan 25;8(1):30. doi: 10.1038/s41392-022-01273-8. Signal Transduct Target Ther. 2023. PMID: 36693826 Free PMC article.
-
Complement Activation in Nephrotic Glomerular Diseases.Biomedicines. 2024 Feb 18;12(2):455. doi: 10.3390/biomedicines12020455. Biomedicines. 2024. PMID: 38398059 Free PMC article. Review.
-
Kidney diseases.Immunol Rev. 2023 Jan;313(1):239-261. doi: 10.1111/imr.13167. Epub 2022 Nov 12. Immunol Rev. 2023. PMID: 36369988 Free PMC article. Review.
References
Publication types
MeSH terms
Substances
Grants and funding
LinkOut - more resources
Full Text Sources
Research Materials
Miscellaneous