

Effect of Dysglycemia on Urinary Lipid Mediator Profiles in Persons With Pulmonary Tuberculosis
- PMID: 35874781
- PMCID: PMC9304990
- DOI: 10.3389/fimmu.2022.919802
Effect of Dysglycemia on Urinary Lipid Mediator Profiles in Persons With Pulmonary Tuberculosis
Abstract
Background: Oxidized lipid mediators such as eicosanoids play a central role in the inflammatory response associated with tuberculosis (TB) pathogenesis. Diabetes mellitus (DM) leads to marked changes in lipid mediators in persons with TB. However, the associations between diabetes-related changes in lipid mediators and clearance of M. tuberculosis (Mtb) among persons on anti-TB treatment (ATT) are unknown. Quantification of urinary eicosanoid metabolites can provide insights into the circulating lipid mediators involved in Mtb immune responses.
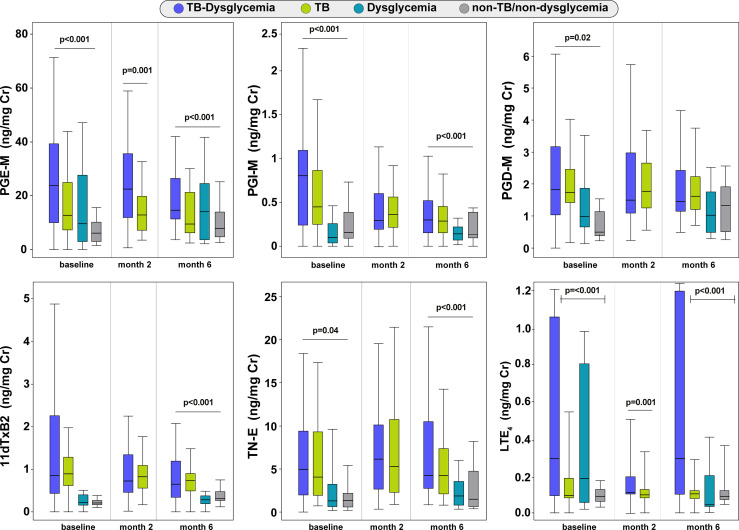
Methods: We conducted a multi-site prospective observational study among adults with drug-sensitive pulmonary TB and controls without active TB; both groups had sub-groups with or without dysglycemia at baseline. Participants were enrolled from RePORT-Brazil (Salvador site) and RePORT-South Africa (Durban site) and stratified according to TB status and baseline glycated hemoglobin levels: a) TB-dysglycemia (n=69); b) TB-normoglycemia (n=64); c) non-TB/dysglycemia (n=31); d) non-TB/non-dysglycemia (n=29). We evaluated the following urinary eicosanoid metabolites: 11α-hydroxy-9,15-dioxo-2,3,4,5-tetranor-prostane-1,20-dioic acid (major urinary metabolite of prostaglandin E2, PGE-M), tetranor-PGE1 (metabolite of PGE2, TN-E), 9α-hydroxy-11,15-dioxo-2,3,4,5-tetranor-prostane-1,20-dioic acid (metabolite of PGD2, PGD-M), 11-dehydro-thromboxane B2 (11dTxB2), 2,3-dinor-6-keto-PGF1α (prostaglandin I metabolite, PGI-M), and leukotriene E4 (LTE4). Comparisons between the study groups were performed at three time points: before ATT and 2 and 6 months after initiating therapy.
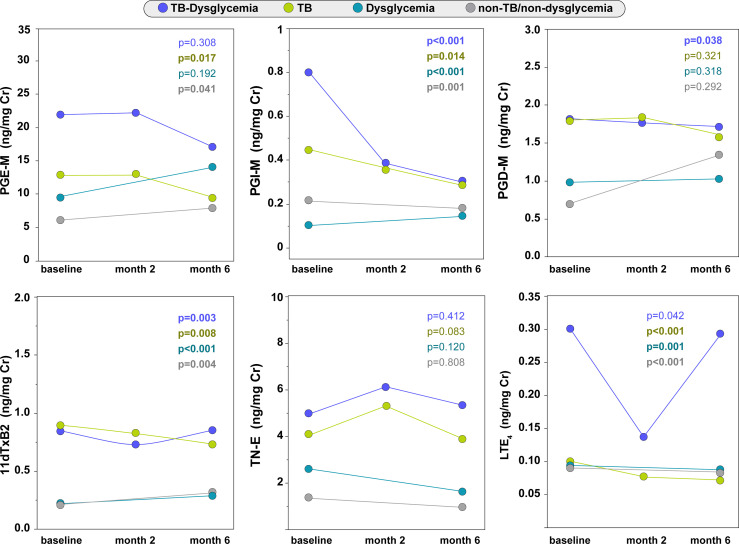
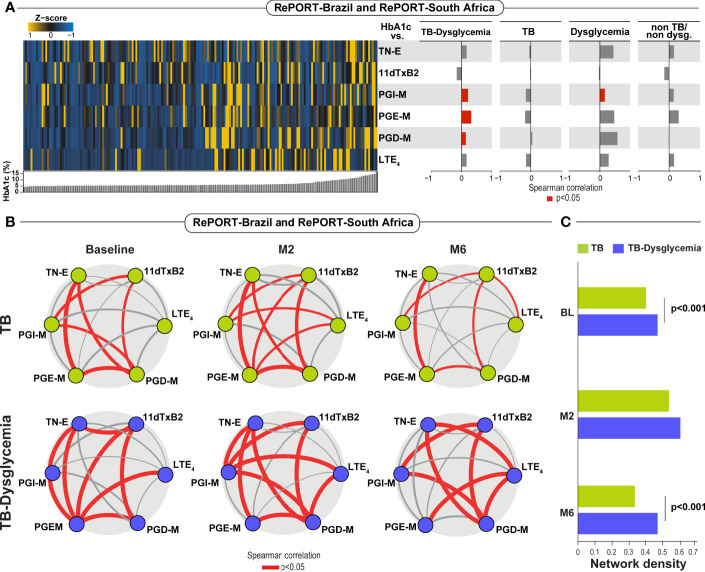
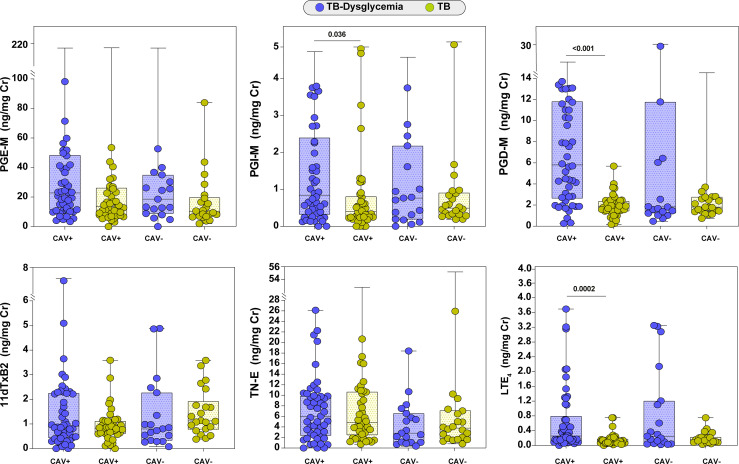
Results: PGE-M and LTE4 values were consistently higher at all three time-points in the TB-dysglycemia group compared to the other groups (p<0.001). In addition, there was a significant decrease in PGI-M and LTE4 levels from baseline to month 6 in the TB-dysglycemia and TB-normoglycemia groups. Finally, TB-dysglycemia was independently associated with increased concentrations of PGD-M, PGI-M, and LTE4 at baseline in a multivariable model adjusting for age, sex, BMI, and study site. These associations were not affected by HIV status.
Conclusion: The urinary eicosanoid metabolite profile was associated with TB-dysglycemia before and during ATT. These observations can help identify the mechanisms involved in the pathogenesis of TB-dysglycemia, and potential biomarkers of TB treatment outcomes, including among persons with dysglycemia.
Keywords: Mycobacterium tuberculosis; anti-tuberculosis treatment; dysglycemia; lipid mediators; urinary eicosanoids.
Copyright © 2022 Arriaga, Karim, Queiroz, Araújo-Pereira, Barreto-Duarte, Sales, Moosa, Mazibuko, Milne, Maruri, Serezani, Koethe, Figueiredo, Kritski, Cordeiro-Santos, Rolla, Sterling, Leslie, Andrade and the RePORT Brazil and South Africa consortia.
Conflict of interest statement
The authors declare that the research was conducted in the absence of any commercial or financial relationships that could be construed as a potential conflict of interest.
Figures

References
-
- World Health Organization . Global Tuberculosis Report 2021. Genova: World Health Organization; (2021).
-
- Slama K, Chiang CY, Enarson DA, Hassmiller K, Fanning A, Gupta P, et al. . Tobacco and Tuberculosis: A Qualitative Systematic Review and Meta-Analysis. Int J Tuberc Lung Dis (2007) 11:1049–61. - PubMed
-
- Noubiap JJ, Nansseu JR, Nyaga UF, Nkeck JR, Endomba FT, Kaze AD, et al. . Global Prevalence of Diabetes in Active Tuberculosis: A Systematic Review and Meta-Analysis of Data From 2.3 Million Patients With Tuberculosis. Lancet Glob Health (2019) 7:e448–60. doi: 10.1016/S2214-109X(18)30487-X - DOI - PubMed
Publication types
MeSH terms
Substances
Grants and funding
LinkOut - more resources
Full Text Sources
Miscellaneous