KCC3a, a Strong Candidate Pathway for K+ Loss in Alkalemia
- PMID: 35874803
- PMCID: PMC9301082
- DOI: 10.3389/fcell.2022.931326
KCC3a, a Strong Candidate Pathway for K+ Loss in Alkalemia
Abstract
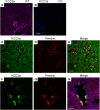
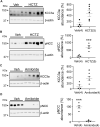
Loss-of-function mutations in the human potassium chloride cotransporter-3 (KCC3) cause a hereditary motor sensory neuropathy associated with agenesis of the corpus callosum. While recapitulating the neuropathy, KCC3-knockout mice also exhibit high blood pressure. This phenotype is believed to have neurogenic and/or vascular origins. The role of KCC3 in the kidney is poorly understood. KCC3 is encoded by two major isoforms originating from alternative promoters: KCC3a and KCC3b, with KCC3b being the predominant transcript in the kidney. Although the transporter has previously been localized to the proximal tubule, we show here the unique expression of the KCC3a isoform in the connecting tubule. Using a KCC3a-specific polyclonal antibody validated for both immunofluorescence and immunoblotting, we showed an intense KCC3a signal restricted to cortical intercalated cells. No overlap is detected between KCC3a and sodium chloride cotransporter (NCC), a distal convoluted tubule (DCT) marker; or between KCC3a and ENaC or calbindin, which are both principal cell markers. KCC3a signal was observed in cells expressing the apical V-ATPase and pendrin, establishing a unique expression pattern characteristic of intercalated cells of type-B or type-nonA/nonB. We further show that treatment of wild-type mice with hydrochlorothiazide, amiloride, or fed a K+-deficient diet up-regulates KCC3a level, suggesting that volume depletion increases KCC3a abundance. This hypothesis was confirmed by showing a higher abundance of KCC3a protein after 23-h water restriction or after placing the mice on a low-salt diet. More importantly, abundance of the Cl-/HCO3 - exchanger, pendrin, which is known to secrete bicarbonate in alkalotic conditions, was significantly diminished in KCC3-knockout mice. In addition, KCC3a abundance increased significantly alongside pendrin abundance in bicarbonate-treated alkalotic mice, providing a credible mechanism for K+ loss in metabolic alkalosis.
Keywords: K+ loss; K–Cl cotransport; bicarbonate; intercalated cells; metabolic alkalosis.
Copyright © 2022 Ferdaus, Terker, Koumangoye and Delpire.
Conflict of interest statement
The authors declare that the research was conducted in the absence of any commercial or financial relationships that could be construed as a potential conflict of interest.
Figures


Similar articles
-
Bicarbonate is the primary inducer of KCC3a expression in renal cortical B-type intercalated cells.Am J Physiol Cell Physiol. 2023 May 1;324(5):C1171-C1178. doi: 10.1152/ajpcell.00094.2023. Epub 2023 Apr 10. Am J Physiol Cell Physiol. 2023. PMID: 37036298 Free PMC article.
-
The K-Cl cotransporter-3 in the mammalian kidney.Curr Opin Nephrol Hypertens. 2023 Sep 1;32(5):482-489. doi: 10.1097/MNH.0000000000000911. Epub 2023 Jun 30. Curr Opin Nephrol Hypertens. 2023. PMID: 37530088 Free PMC article. Review.
-
NH2-terminal heterogeneity in the KCC3 K+-Cl- cotransporter.Am J Physiol Renal Physiol. 2005 Dec;289(6):F1246-61. doi: 10.1152/ajprenal.00464.2004. Epub 2005 Jul 26. Am J Physiol Renal Physiol. 2005. PMID: 16048901
-
Dietary anions control potassium excretion: it is more than a poorly absorbable anion effect.Am J Physiol Renal Physiol. 2023 Sep 1;325(3):F377-F393. doi: 10.1152/ajprenal.00193.2023. Epub 2023 Jul 27. Am J Physiol Renal Physiol. 2023. PMID: 37498547 Free PMC article.
-
The role of pendrin in renal physiology.Annu Rev Physiol. 2015;77:363-78. doi: 10.1146/annurev-physiol-021014-071854. Annu Rev Physiol. 2015. PMID: 25668022 Review.
Cited by
-
Angiotensin II hypertension along the female rat tubule: predicted impact on coupled transport of Na+ and K.Am J Physiol Renal Physiol. 2023 Dec 1;325(6):F733-F749. doi: 10.1152/ajprenal.00232.2023. Epub 2023 Oct 12. Am J Physiol Renal Physiol. 2023. PMID: 37823196 Free PMC article.
-
Activation of 2-oxoglutarate receptor 1 (OXGR1) by α-ketoglutarate (αKG) does not detectably stimulate Pendrin-mediated anion exchange in Xenopus oocytes.Physiol Rep. 2022 Jul;10(14):e15362. doi: 10.14814/phy2.15362. Physiol Rep. 2022. PMID: 35851763 Free PMC article.
-
Secretin: a hormone for HCO3- homeostasis.Pflugers Arch. 2024 Apr;476(4):545-554. doi: 10.1007/s00424-024-02906-3. Epub 2024 Jan 15. Pflugers Arch. 2024. PMID: 38221598 Review.
-
The biogenesis of potassium transporters: implications of disease-associated mutations.Crit Rev Biochem Mol Biol. 2024 Jun-Aug;59(3-4):154-198. doi: 10.1080/10409238.2024.2369986. Epub 2024 Jul 1. Crit Rev Biochem Mol Biol. 2024. PMID: 38946646 Free PMC article. Review.
-
Novel functions of the anion exchanger AE4 (SLC4A9).Pflugers Arch. 2024 Apr;476(4):555-564. doi: 10.1007/s00424-023-02899-5. Epub 2024 Jan 9. Pflugers Arch. 2024. PMID: 38195948 Free PMC article. Review.
References
-
- Andermann E., Andermann F., Nagy R., Bergeron D., Mathieu J., Langevin P. (1994). “Genetic Studies of the Andermann Syndrome,” in Callosal Agenesis: A Natural Split Brain? (Montreal: Springer; ), 31–38. 10.1007/978-1-4613-0487-6_5 - DOI
-
- Andermann F., Andermann E., Joubert M., Karpati G., Carpenter S., Melancon D. (1972). Familial Agenesis of the Corpus Callosum with Anterior Horn Cell Disease: a Syndrome of Mental Retardation, Areflexia and Paraparesis. Trans. Am. Neurol. Assoc. 97, 242–244.
Grants and funding
LinkOut - more resources
Full Text Sources
Molecular Biology Databases

