. 2022 Jul 6:10:940622.
doi: 10.3389/fcell.2022.940622. eCollection 2022.

Pitx2 Differentially Regulates the Distinct Phases of Myogenic Program and Delineates Satellite Cell Lineages During Muscle Development

Affiliations

Pitx2 Differentially Regulates the Distinct Phases of Myogenic Program and Delineates Satellite Cell Lineages During Muscle Development

Felícitas Ramírez de Acuña et al. Front Cell Dev Biol. .

Abstract

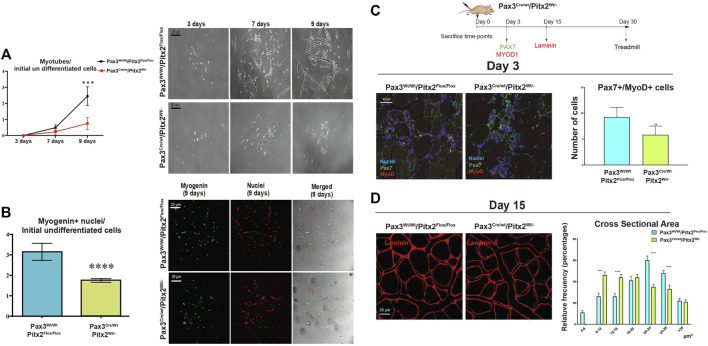
The knowledge of the molecular mechanisms that regulate embryonic myogenesis from early myogenic progenitors to myoblasts, as well as the emergence of adult satellite stem cells (SCs) during development, are key concepts to understanding the genesis and regenerative abilities of the skeletal muscle. Several previous pieces of evidence have revealed that the transcription factor Pitx2 might be a player within the molecular pathways controlling somite-derived muscle progenitors' fate and SC behavior. However, the role exerted by Pitx2 in the progression from myogenic progenitors to myoblasts including SC precursors remains unsolved. Here, we show that Pitx2 inactivation in uncommitted early myogenic precursors diminished cell proliferation and migration leading to muscle hypotrophy and a low number of SCs with decreased myogenic differentiation potential. However, the loss of Pitx2 in committed myogenic precursors gave rise to normal muscles with standard amounts of SCs exhibiting high levels of Pax7 expression. This SC population includes few MYF5+ SC-primed but increased amount of less proliferative miR-106b+cells, and display myogenic differentiation defects failing to undergo proper muscle regeneration. Overall our results demonstrate that Pitx2 is required in uncommitted myogenic progenitors but it is dispensable in committed precursors for proper myogenesis and reveal a role for this transcription factor in the generation of diverse SC subpopulations.

Keywords: Pitx2; myogenesis; myogenic precursors; satellite cells; somites.


Conflict of interest statement

The authors declare that the research was conducted in the absence of any commercial or financial relationships that could be construed as a potential conflict of interest.

Figures

FIGURE 1
FIGURE 1
Analysis of Pax3Cre/Wt Pitx2−/− conditional mutants. (A) Mendelian ratios and survival rates for Pax3Wt/Wt/Pitx2Flox/Flox, Pax3Cre/Wt/Pitx2Flox/Wt, Pax3Cre/Wt/Pitx2Wt/- and Pax3Cre/Wt Pitx2−/− mice at neonatal (n = 52) and adult stage (n = 70). (B) Schematic representation of morphometric analyses in Pax3Cre/Wt/Pitx2−/− mutant embryos (E13.5) carried out by evaluating limb length (black line) as well as limb areas (delineated by dotted area) by using the image J software (NIHImage) in a total of 40 embryos (n = 10 for Pax3Cre/Wt/Pitx2−/−, n = 13 for Pax3Cre/Wt/Pitx2Wt/- and n = 17 for Pax3Wt/Wt/Pitx2Flox/Flox). Quantification of limb length, limb area and body are shown.**p < 0.01. Ocular defects are indicated by a black arrow.
FIGURE 2
FIGURE 2
Cell migration of Pax3 + precursors is reduced in Pax3Cre/Wt Pitx2−/− conditional mutant embryos. (A) Representative images of in situ hybridization for Pax3 in Pax3Wt/Wt/Pitx2Flox/Flox, Pax3Cre/Wt Pitx2Wt/- and Pax3Cre/Wt Pitx2−/− embryos at E10.5. Pax3+ cells in the limb buds are dotted. Quantification of the area of Pax3-expressing cells in the limb buds of Pax3Cre/Wt Pitx2−/− conditional mutant embryos is shown. (B) Representative images and its magnification of immunohistochemistry for c-MET in Pax3Wt/Wt/Pitx2Flox/Flox, Pax3Cre/Wt Pitx2Wt/- and Pax3Cre/Wt Pitx2−/−embryos at E10.5. Quantification of the number of cMET+ cells with respect to total nuclei in the limb buds of Pax3Cre/Wt Pitx2−/− conditional mutant embryos is shown. (C) Representative images of in situ hybridization for Myod1 and Myog in Pax3CreWt/Wt/Pitx2Flox/Flox, Pax3Cre/Wt/Pitx2Wt/- and Pax3Cre/Wt/Pitx2−/− at E13.5 stage. Myod1 and Myog expresion zones in the limb buds are dotted. **p < 0.01, ***p < 0.001 (n = at least 3 embryos per condition).
FIGURE 3
FIGURE 3
The myotome area as well as the number of Ki67+ cells is reduced in Pax3Cre/Wt/Pitx2−/−conditional mutant embryos. (A) Representative images of DESMIN (dotted area) and KI67 co-immunostaining in the myotome of Pax3Wt/Wt/Pitx2Flox/Flox, Pax3Cre/Wt/Pitx2Wt/- and Pax3Cre/Wt/Pitx2−/− mice at E10.5 stage. Quantification of Ki67+ cells in the myotome is shown. (B) Representative images of in situ hybridization for Myod1 and Myogenin (MyoG) in Pax3Wt/Wt/Pitx2Flox/Flox, Pax3Cre/Wt/Pitx2Wt/−and Pax3Cre/Wt/Pitx2−/− embryos at E10.5 and E13.5 stages. Note that Myod1 and Myogenin staining at E13.5 are delineated by yellow bars. *p < 0.1, ***p < 0.001 (n = at least 3 embryos per condition).
FIGURE 4
FIGURE 4
At fetal stages Pax3Cre/Wt/Pitx2−/− mutants display muscle hypotrophy together with altered secondary myogenesis and myoblasts differentiation. (A) Representative images of MF20 immunostaining in Epaxial, Hypaxial muscles and diaphragm in Pax3Wt/Wt/Pitx2Flox/Flox, Pax3Cre/Wt/Pitx2Wt/- and Pax3Cre/Wt/Pitx2−/− embryo at E14.5 stage. (B) Representative images of MF20 and Laminin immunostaining in Pax3Wt/Wt/Pitx2Flox/Flox, Pax3Cre/Wt/Pitx2Wt/- and Pax3Cre/Wt/Pitx2−/−embryo at E14.5 stage. Percentage of secondary myotubes is shown. (C) Representative images of cultured myoblasts isolated from the limbs of E18.5 Pax3Wt/Wt/Pitx2Flox/Flox, Pax3Cre/Wt/Pitx2Wt/- and Pax3Cre/Wt/Pitx2−/− embryos stained with anti-MHC antibody. Quantification of index fusion is shown. *p < 0.1, ***p < 0.001 (n = at least 3 embryos per condition).
FIGURE 5
FIGURE 5
Neonates of Pax3Cre/Wt/Pitx2−/− conditional mutant show reduced muscle size and a lower amount of proliferative SC. (A) Representative images of PAX7 and Laminin co-immunostaining in the TA muscles of Pax3Wt/Wt/Pitx2Flox/Flox, Pax3Cre/Wt/Pitx2Wt/- and Pax3Cre/Wt/Pitx2−/− mice at neonatal stage. Distribution of cross-sectional area in tibialis anterior (TA) muscles and percentage of PAX7+ cells are shown. (B) Representative images of PAX7 and KI67 co-immunostaining in the TA muscles of Pax3Wt/Wt/Pitx2Flox/Flox, Pax3Cre/Wt/Pitx2Wt/- and Pax3Cre/Wt/Pitx2−/− mice at neonatal stage. Percentage of PAX7+/KI67+ cells is shown. **p < 0.01, ****p < 0.0001(n = at least 3 neonates per condition).
FIGURE 6
FIGURE 6
Pax3Cre/Wt/Pitx2Wt/- conditional mutant adults show reduced CSA as well as minor population of SC. (A) Representative images of PAX7 and LAMININ in the TA muscles of Pax3Wt/Wt/Pitx2Flox/Flox, Pax3Cre/Wt/Pitx2Wt/Wt and Pax3Cre/Wt/Pitx2Wt/- mice at adult stage (A,B). Distribution of cross-sectional area in tibialis anterior (TA) muscles. Percentage of PAX7+ cells is shown. **p < 0.01, ****p < 0.0001 (n = at least 3 mice per condition).
FIGURE 7
FIGURE 7
SC differentiation and muscle regeneration are compromised in adult Pax3Cre/Wt/Pitx2Wt/- heterozygous mice. (A) Ratio of number of myotubes per initial undifferentiated cells (day 3 of culture) through in vitro differentiation (7 and 9 days of culture) in SC isolated from Pax3Wt/Wt/Pitx2Flox/Flox vs. SC from Pax3Cre/Wt/Pitx2Flox/, and representative images of in vitro differentiation. (B) Relative values of number of myogenin + nuclei in differentiated cells (day 9 of culture) per initial undifferentiated cells in SC isolated from Pax3Wt/Wt/Pitx2Flox/Flox vs. SC from Pax3Cre/Wt/Pitx2Flox/, and representative images of myogenin + nuclei. (C) Scheme of CTX injection in the TA of Pax3Cre/Wt/Pitx2Wt/Wt and Pax3Cre/Wt/Pitx2Wt/- mice and representative image of PAX7+/MYOD1+ cells at day 3 after cardiotoxin injection in tibialis anterior muscle (TA). Percentage of PAX7+/MYOD1+ cells is shown. (D) Representative images of LAMININ staining in tibialis anterior (TA) muscles of Pax3Cre/Wt/Pitx2Wt/- heterozygous mice vs. Controls Pax3Cre/Wt/Pitx2Wt/- mice at day 15 after cardiotoxin injection. Cross-sectional area is shown.*p < 0.0.1, ***p < 0.001, ****p < 0.0001 (n = at least 3 mice per condition).
FIGURE 8
FIGURE 8
Myf5Cre/Wt/Pitx2−/− mice have normal survival rates but possess satellite cells with high Pax7 expression. (A) Survival rates for Myf5Wt/Wt/Pitx2Flox/Flox, Myf5Wt/Wt/Pitx2Flox/Wt, Myf5Cre/Wt/Pitx2Wt/- and Myf5Cre/Wt/Pitx2−/− mice. (B) Representative images of PAX7 and LAMININ co-immunostaining in the TA muscles of Myf5Wt/Wt/Pitx2Flox/Flox, Myf5Cre/Wt/Pitx2Wt/- and Myf5Cre/Wt/Pitx2−/− mice and quantification of PAX7+ cells. (C) qRT-PCR analyses for Pax7 in the TA muscles of Myf5Wt/WtPitx2Flox/Flox, Myf5Cre/Wt/Pitx2Wt/- and Myf5Cre/Wt/Pitx2−/− mice. *p < 0.1, **p < 0.01 (n = at least 3 mice per condition).
FIGURE 9
FIGURE 9
The muscles of Myf5Cre/Wt Pitx2−/− mice have high amounts of miR-106b+ cells but lower numbers of Myf5 cells. (A) Representative images of miR-106b in situ hybridization (FISH) in the TA muscles of Myf5Cre/Wt/Pitx2Wt/Wt and Myf5Cre/Wt/Pitx2−/− mice and quantification of miR-106b+ cells. (B) Representative images of MYF5+ cells in the TA muscles of Myf5Cre/Wt/Pitx2−/− conditional mutants and quantification of MYF5+ cells. (C) Representative images of FISH for miR-106b and Pitx2 immunostaining in c57 wild-type embryos at E10.5. ***p < 0.001, ****p < 0.0001 (n = at least 3 mice per condition).
FIGURE 10
FIGURE 10
Myf5Cre/Wt/Pitx2−/− mice show altered muscle regeneration. (A) Ratio of number of myotubes per initial undifferentiated cells (day 3 of culture) through in vitro differentiation (7 and 9 days of culture) in SC isolated from Myf5Wt/Wt/Pitx2Flox/Flox, Myf5Cre/Wt/Pitx2Wt/- and Myf5Cre/Wt/Pitx2−/− mice. Representative images of in vitro differentiation. (B) Representative images of MF20 immunostaining in 3 days cultured myoblasts from Myf5Wt/Wt/Pitx2Flox/Flox, Myf5Cre/Wt/Pitx2Wt/- and Myf5Cre/Wt/Pitx2−/− mice. Percentage of nuclei per MF20+ myofiber is shown. (C) Scheme of CTX injection in the TA of C57BL/6 mice Myf5Wt/Wt/Pitx2Flox/Flox, Myf5Cre/Wt/Pitx2Wt/- and Myf5Cre/Wt/Pitx2−/− mice and representative image of KI67+/MYOD1+ cells at day 3 after cardiotoxin injection. Percentage of KI67+/MYOD1+ cells is shown. (D) Representative image of eMyHC staining at day 7 after cardiotoxin injection in tibialis anterior muscle (TA) of Myf5Wt/Wt/Pitx2Flox/Flox, Myf5Cre/Wt/Pitx2Wt/- and Myf5Cre/Wt/Pitx2−/−. Percentage of eMyHC+ myofibers is shown. (E) Representative image of Hematoxilin-Eosin staining at day 15 after cardiotoxin injection in tibialis anterior muscle (TA) of Myf5Wt/Wt/Pitx2Flox/Flox, Myf5Cre/Wt/Pitx2Wt/- and Myf5Cre/Wt/Pitx2−/−. Percentage of centralized nuclei as well as Cross Sectional Area Distribution at day 15 after cardiotoxin injection are shown-. *p < 0.1, ***p < 0.001, ****p < 0.001 (n = at least 3 mice per condition).

Similar articles

Cited by

References

    1. Abu-Elmagd M., Robson L., Sweetman D., Hadley J., Francis-West P., Münsterberg A. (2010). Wnt/Lef1 Signaling Acts via Pitx2 to Regulate Somite Myogenesis. Dev. Biol. 337, 211–219. 10.1016/j.ydbio.2009.10.023 - DOI - PubMed
    1. Ammirabile G., Tessari A., Pignataro V., Szumska D., Sutera Sardo F., Benes J., et al. (2012). Pitx2 Confers Left Morphological, Molecular, and Functional Identity to the Sinus Venosus Myocardium. Cardiovasc. Res. 93, 291–301. 10.1093/cvr/cvr314 - DOI - PMC - PubMed
    1. Bachman J. F., Klose A., Liu W., Paris N. D., Blanc R. S., Schmalz M., et al. (2018). Prepubertal Skeletal Muscle Growth Requires Pax7-Expressing Satellite Cell-Derived Myonuclear Contribution. Dev. Camb. Engl 145, dev167197. 10.1242/dev.167197 - DOI - PMC - PubMed
    1. Baek S. H., Kioussi C., Briata P., Wang D., Nguyen H. D., Ohgi K. A., et al. (2003). Regulated Subset of G 1 Growth-Control Genes in Response to Derepression by the Wnt Pathway. Proc. Natl. Acad. Sci. U.S.A. 100, 3245–3250. 10.1073/pnas.0330217100 - DOI - PMC - PubMed
    1. Bentzinger C. F., Wang Y. X., Rudnicki M. A. (2012). Building Muscle: Molecular Regulation of Myogenesis. Cold Spring Harb. Perspect. Biol. 4, a008342. 10.1101/cshperspect.a008342 - DOI - PMC - PubMed

LinkOut - more resources