. 2022 May 5;25(6):104353.
doi: 10.1016/j.isci.2022.104353. eCollection 2022 Jun 17.

Neuropilin-1 cooperates with PD-1 in CD8+ T cells predicting outcomes in melanoma patients treated with anti-PD1

Affiliations

Neuropilin-1 cooperates with PD-1 in CD8+ T cells predicting outcomes in melanoma patients treated with anti-PD1

Julien Rossignol et al. iScience. .

Abstract

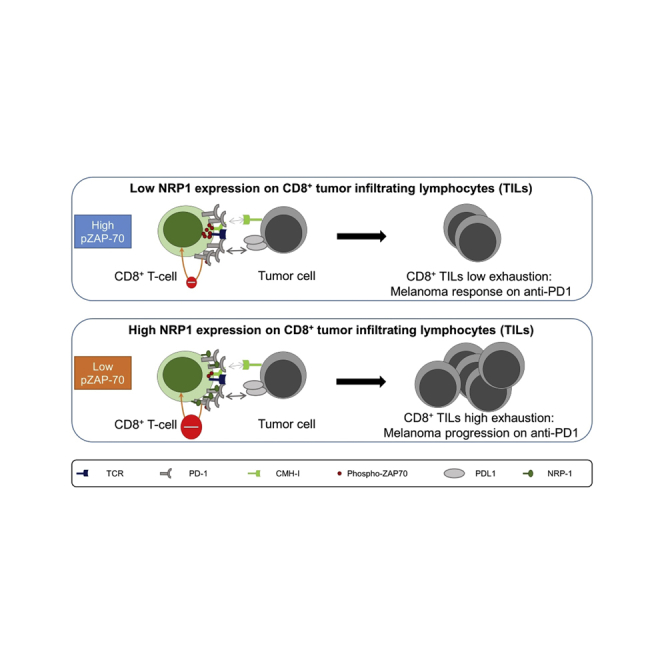
Targeting immune checkpoints, such as Programmed cell Death 1 (PD1), has improved survival in cancer patients by restoring antitumor immune responses. Most patients, however, relapse or are refractory to immune checkpoint blocking therapies. Neuropilin-1 (NRP1) is a transmembrane glycoprotein required for nervous system and angiogenesis embryonic development, also expressed in immune cells. We hypothesized that NRP1 could be an immune checkpoint co-receptor modulating CD8+ T cells activity in the context of the antitumor immune response. Here, we show that NRP1 is recruited in the cytolytic synapse of PD1+CD8+ T cells, cooperates and enhances PD-1 activity. In mice, CD8+ T cells specific deletion of Nrp1 improves anti-PD1 antibody antitumor immune responses. Likewise, in human metastatic melanoma, the expression of NRP1 in tumor infiltrating CD8+ T cells predicts poor outcome of patients treated with anti-PD1. NRP1 is a promising target to overcome resistance to anti-PD1 therapies.

Keywords: Cancer; Immunology.


Conflict of interest statement

The authors declare no competing interests.

Figures

None
Graphical abstract
Figure 1
Figure 1
NRP1 is expressed in activated CD8+ T cells and controls their antitumoral function in mice (A) NRP1 expression and cell trace intensity analyzed by flow cytometry in OT1 murine CD8+ T cells activated during 24, 48, 72, and 96 h with OVA257 peptide pulsed on dendritic cells (SIINFEKL, 10−9 mg/mL). Data are representative of 5 independent experiments. (B) Flow cytometry analysis of NRP1 expression in OT1 murine CD8+ T cells, 72 h after activation with OVA peptide (SIINFEKL, 10−9 mg/mL). Expression is shown according to different effector CD8+ T cell / antigen-presenting cell (DC) ratios (E/A ratio: 1/1, 2/1, 4/1, and 8/1). p value (p = 0.0006) was determined by one-way ANOVA. Data are representative of 2 independent experiments. Expression was assessed by flow cytometry and data are presented as the mean ± SEM of percentage of NRP1 on CD8+ T cells (c) Expression of NRP1 in CD8+ T cells from B6 mice, after intramuscular immunization with AAV-OVA vector. Expression was assessed by flow cytometry and data are presented as the mean ± SEM of percentage of NRP1 on iTAg Tetramer/PE - H-2 Kb OVA, at day 7, 14, 21, 28, and 35 after immunization. Data are representative of 5 independent experiments. (D) NRP1 expression profiles in H2-Db GP33-specific CD8+ T cells according to in vivo infection in mice with LCMV Armstrong (n = 16), LCMV clone 13 (n = 16), or naïve CD44low CD8+ T cells from controls (n = 4) at days 6, 8, 15, and 30. Raw transcriptomic data were from Doering et al. (2012) microarray experiments [32]. Data are presented as the mean ± SEM p value was determined by two-way ANOVA(p = 0.0008). (E) Flow cytometry analysis of NRP1 expression (blue line curve) on iTAg Tetramer/PE - H-2 Kb OVA CD8+ TILs collected from C57BL/6 mice bearing a B16-OVA tumor at day 14 post-immunization with ovalbumin and poly-IC. Data are representative of 3 independent experiments. (F) Flow cytometry analysis of NRP1 and PD1 expression in OT1 CD8+ T cells activated with OVA257 peptide (SIINFEKL, 10−9M) at 24, 48, 72, and 96 h post-activation. Data are representative of 3 independent experiments. (H) Mice were pre-immunized (immunized) or not pre-immunized (control) with ovalbumin and poly-IC. B16-OVA tumor volume was assessed at day 0, 8, 11, 14, and 18 post-immunization in CD8Nrp1KO (KO) and control C8Cre (WT) mice. Data are presented as mean ± SEM. p values were determined by using student t-test ∗∗∗p < 0.001, ∗p < 0.05. Data are representative of 3 independent experiments. (G) CD8Nrp1KO (KO) and control (WT) mice were injected in the right flank with 1 × 105 TC1 lung tumor cells subcutaneously. Data are presented as mean ± SEM p values was determined by using student t-test ∗∗p < 0.01, ∗p < 0.05. Data are representative of 3 independent experiments (I) CD8Nrp1KO (KO) and control (WT) mice were pre-immunized with ovalbumin and poly-IC. Tumor volume was assessed 21 days after immunization. Data are presented as mean ± SEM p values was determined by using student t-test (p = 0.0012). Data are representative of 3 independent experiments. (J) Number of CD8+ TILs per fields with highest CD8+ T cells infiltration from CD8Nrp1KO mice (KO) or controls (WT) assessed by confocal microscopy at day 21 post immunization with ovalbumin and poly-IC. Data are presented as mean ± SEM. p values (p < 0.0001) was determined by using student t-test. Data are representative of 3 tumors per group. (K) Percentages of Tetramer/PE - H-2 Kb OVA CD8+ TILs in B16-OVA tumors of four different mice group assessed at day 14 post-immunization by flow cytometry from CD8Nrp1KO (KO) and control (WT) mice immunized or not immunized (control) with ovalbumin and poly-IC. Data are presented as the mean percentage of CD8+ TILs Tetramer positive ± SEM. p values were determined by using student T test ∗∗p < 0.01, ∗p < 0.05. Data are representative of 2 independent experiments. (L) Ex vivo TILs proliferation was analyzed by flow cytometry 72 h post-activation with anti-CD3 and anti-CD28. TILs were collected from B16-OVA tumors at day 21 post-immunization from 3 mice. Data are presented as the mean percentage of divided CD8+ T cells ± SEM. p values was determined by using student t-test ∗∗∗p < 0.001. Data are representative of 2 independent experiments.
Figure 2
Figure 2
NRP1 modulates PD1 activity at the synapse between CD8+ T cells and tumor cells (A) Illustrative image of phalloidin (yellow), CD8 (pink), CFP from EL4 (purple), and NRP1 (red) labeling in the synapse model between activated OT1 CD8+ T cells and EL4-CFP tumor cells bearing OVA257 (SIINFEKL), observed by ImageStream. The synapse is the high phalloidin labeling zone. Bright field image is in white (scale bar = 7μm). Data are representative of 4 independent experiments from 2 synapse models. (B) Quantification by ImageStream of NRP1 expression (mean pixel intensity/MPI) in an allogeneic synapse model between activated CD8+ T cells and cell tracer violet labeled A20 cells. NRP1 expression was analyzed in activated CD8+ T cells at the synapse junction (high phalloidin labeling zone). Data are presented as the mean MPI ± SEM. p value (p < 0.0001) was determined by Wilcoxon matched pairs test. Data are representative of 4 independent experiments from 2 synapse models. (C) Illustrative image of phalloidin (yellow), phospho-ZAP70 (green), CD8 (red), cell tracer violet labeled A20 tumor cells (purple), and NRP1 (white) between activated NRP1high or NRP1low CD8+ T cells and cell tracer violet labeled A20 tumor cells observed by ImageStream. The synapse is the high phalloidin labeling zone. Bright field image is in white (scale bar = 7μm). Data are representative of 2 independent experiments. (D) Quantification by Imagestream of phospho-ZAP70 amounts (mean pixel intensity/MPI) in the synapse junction (high phalloidin labeling zone) between activated NRP1high or NRP1low CD8+ T cells and cell tracer violet labeled A20 tumor cells. Data are presented as mean MPI ± SEM. p value (p < 0.0001) was determined by Mann Whitney test. Data are representative of 2 independent experiments. (E) Left panel: CD8 (green) NRP1 (red), PD1 (blue), and NRP1/PD1 merge (purple) expression observed by confocal microscopy in CD8+ TILs from control mice (WT) at day 21 post-activation (x63 oil objective, scale bar = 10 μm). Data are representative of 3 tumors. Right panel: Colocalization of NRP1 and PD1 was assessed by the calculation of Pearson coefficient. Data from 10 CD8+ TILs analyzed are presented as mean ± SEM. (F) Phospho-ZAP70 signal according to its localization within the synapse between the CD8+ T cells and the tumor cells. Illustrative image of phalloidin (yellow), phospho-ZAP70 (green), CD8 (red), and Cell Tracer (A20 cells, purple) labeling in the synapse model between activated CD8+ T cells from CD8Nrp1KO mice (KO) or controls (WT) and allogeneic A20 tumor cells, by ImageStream. Bright field image is in white (scale bar = 7μm). Data are representative of 2 independent experiments. (G) Phospho-ZAP70 signal according to its localization within the synapse between the CD8+ T cells and the tumor cells. Quantification by Image stream of phospho-ZAP70 amounts (mean pixel intensity/MPI) in the synapse junction (high phalloidin labeling zone) between activated CD8+ T cells from CD8Nrp1KO mice (KO) or control mice (WT), and cell tracer violet labeled A20 tumor cells. Data are presented as mean MPI ± SEM. p value (p < 0.0001) was determined by Mann Whitney test. Data are representative of 2 independent experiments. (H) Proximity of NRP1 and PD1 proteins demonstrated by Duolink assay on in vitro activated CD8+ T cells from C57BL/6J mice. Upper panel: Left: Negative control experiments performed using anti-IRAP and anti-NRP1 antibodies (PLA-Duolink). Right: NRP1/PD1 complexes (anti-NRP1 and anti-PD1 antibodies with PLA-Duolink). The red spots indicate less than 40nm proximity between cellular-bound antibodies. Nuclei are stained with DAPI (blue). Images have been observed by confocal microscopy (x63 oil objective, scale bar = 10μm). Data are representative of 5 independent experiments. Lower panel: Comparison of number of PLA plots per cell. Data are presented as mean ± SEM. (I) NRP1 and PD1 interaction was demonstrated by CoIP experiments performed in splenocytes from C57BL/6J mice activated with anti-CD3 and anti-CD28 antibodies. NRP1 and PD1 immunoblot (IB) detection is shown in total lysate (TL) as control, in eluate from IgG Control (ctl) IP, and from NRP1 IP (N = 1 experiment). NRP1/PD1 Co-IP was also observed after PD1 IP (N = 2 experiment). Data are representative of 3 independent experiments. (J) Quantification by Imagestream of PD1 expression (MPI) in the synapse junction (high phalloidin labeling zone) between activated CD8+ T cells from CD8Nrp1KO mice (KO) or controls (WT), and allogeneic A20 tumor cells. Data are presented as mean MPI ± SEM. p value (p < 0.0001) was determined by Mann Whitney test. Data are representative of 2 independent experiments.
Figure 3
Figure 3
Targeting both NRP1 and PD1 has a synergistic effect in human and mouse CD8+ T cells immune response (A) Flow cytometry analysis of NRP1 expression according to cell trace on human CD8+ T cells 96 h after activation with anti-CD3 and anti-CD28, or on nonactivated cells. Data are representative of 5 independent experiments. (B) Flow cytometry analysis of NRP1 and PD1 expression in human CD8+ T cells 96 h after in vitro activation with anti-CD3 and anti-CD28 or non-activated cells. Data are representative of 3 independent experiments. (C) Flow cytometry analysis of NRP1 and PD1 expression in CD8+ TILs. Data are representative of 3 independent experiments in human endometrial, kidney, and ovarian cancer. (D) Flow cytometry analysis of phospho-ZAP70 in PD1+CD8+ TILs according to NRP1 expression. Data from one experiment in human endometrial cancer. (E) Flow cytometry analysis of percentage of divided CD8+ T cells from a patient bearing an NRP1 haploinsufficiency (patient) or from controls (N = 5), respective to SEB superantigen concentration (0, 1, 10, or 100 ng/mL), in the presence or not of anti-PD1 antibody. Activation was performed during 72 h. Data are presented as the mean ± SEM. Data representative of 1 experiment. (F) Flow cytometry analysis of CD25 expression in CD8+ T cells from a patient bearing an NRP1 haploinsufficiency (patient) or from controls (N = 5), respective to SEB superantigen concentration (0, 1, 10, or 100 ng/mL), in the presence or not of anti-PD1 antibody. Activation was performed during 72 h. Data are presented as the mean % of CD25 expression ± SEM. Data representative of 1 experiment. (G) NRP1/PD-1 complexes detection by Proximity-Ligation-Assay (PLA) technology on CD8+ TILs in human colon cancer. Left panel: Representative area of tumor tissue observed. Acquisition with NDPI view software. Middle panel: Tumor infiltrating NRP1+PD1+CD8+ T cells (pink): Merge of green CD8 staining (FITC) and orange NRP1/PD-1 spots (TRITC). Acquisition with NDPI view software: zoom in x20. Right panel: CD8+ NRP1/PD1 positive cell (Pink) and CD8+ NRP1/PD1 negative cells (green). Acquisition with NDPI view software: zoom in x40. Nuclei are stained with DAPI (blue). Images have been observed by confocal microscopy ×20 oil objective. Data are representative of 10 independent experiments. (H) CD8Nrp1KO (KO) and control (WT) mice were pre-immunized with ovalbumin and poly-IC and treated or not with anti-PD1 antibody in vivo. B16-OVA tumor volume was assessed until 35 days after immunization. Data are presented as the mean ± SEM and as Kaplan Meyer curve. p values were determined by two-way ANOVA test ∗∗∗p < 0.001 ∗∗p < 0.01. Data are representative of 5 experiments. (I) CD8Nrp1KO (KO) and control (WT) mice were pre-immunized with ovalbumin and poly-IC and treated or not with anti-PD1 antibody in vivo. Overall survival was assessed until 50 days after immunization. Data are presented as the mean ± SEM and as Kaplan Meyer curve. p values were determined by Log rank test ∗∗∗p < 0.001. Data are representative of 5 experiments. (J) Analysis of overall survival of patients with metastatic melanoma treated with anti-PD1, according to RNA NRP1 expression (low or high expression: groups have been determined according to ROC curve analysis) assessed in the tumor before anti-PD1 treatment. Data from transcriptomics analysis of metastatic melanoma tumors were available from Hugo et al. (Hugo et al., 2016) Data are presented as Kaplan Meyer curve. p value (p = 0.040) was determined by Log-rank test (n = 25 patients). (K) Analysis of relapse free survival of patients with metastatic melanoma treated with anti-PD1 and reached at least a partial response, according to NRP1 expression (NRP1-/low compared with NRP1+/high) in CD8+ TILs assessed by immunohistochemistry before starting therapy. Blind analysis has been performed to assess NRP1 expression. Data are presented as the Kaplan Meyer curve. p value (p = 0.042) was determined by Log-rank test (n = 15 patients).

References

    1. Baitsch L., Baumgaertner P., Devevre E., Raghav S.K., Legat A., Barba L., Wieckowski S., Bouzourene H., Deplancke B., Romero P., et al. Exhaustion of tumor-specific CD8(+) T cells in metastases from melanoma patients. J. Clin. Invest. 2011;121:2350–2360. doi: 10.1172/JCI46102. - DOI - PMC - PubMed
    1. Bartolo L., Li Chung Tong S., Chappert P., Urbain D., Collaud F., Colella P., Richard I., Ronzitti G., Demengeot J., Gross D.A., et al. Dual muscle-liver transduction imposes immune tolerance for muscle transgene engraftment despite preexisting immunity. JCI Insight. 2019;4:e127008. doi: 10.1172/jci.insight.127008. - DOI - PMC - PubMed
    1. Blackburn S.D., Shin H., Freeman G.J., Wherry E.J. Selective expansion of a subset of exhausted CD8 T cells by αPD-L1 blockade. Proc. Natl. Acad. Sci. U S A. 2008;105:15016–15021. doi: 10.1073/pnas.0801497105. - DOI - PMC - PubMed
    1. Blackburn S.D., Shin H., Haining W.N., Zou T., Workman C.J., Polley A., Betts M.R., Freeman G.J., Vignali D.A.A., Wherry E.J. Coregulation of CD8+ T cell exhaustion by multiple inhibitory receptors during chronic viral infection. Nat. Immunol. 2009;10:29–37. doi: 10.1038/ni.1679. - DOI - PMC - PubMed
    1. Butte M.J., Keir M.E., Phamduy T.B., Sharpe A.H., Freeman G.J. Programmed death-1 ligand 1 interacts specifically with the B7-1 costimulatory molecule to inhibit T cell responses. Immunity. 2007;27:111–122. doi: 10.1016/j.immuni.2007.05.016. - DOI - PMC - PubMed