. 2022 May 25;25(6):104463.
doi: 10.1016/j.isci.2022.104463. eCollection 2022 Jun 17.

Single-cell transcriptomes underscore genetically distinct tumor characteristics and microenvironment for hereditary kidney cancers

Affiliations

Single-cell transcriptomes underscore genetically distinct tumor characteristics and microenvironment for hereditary kidney cancers

Ryosuke Jikuya et al. iScience. .

Abstract

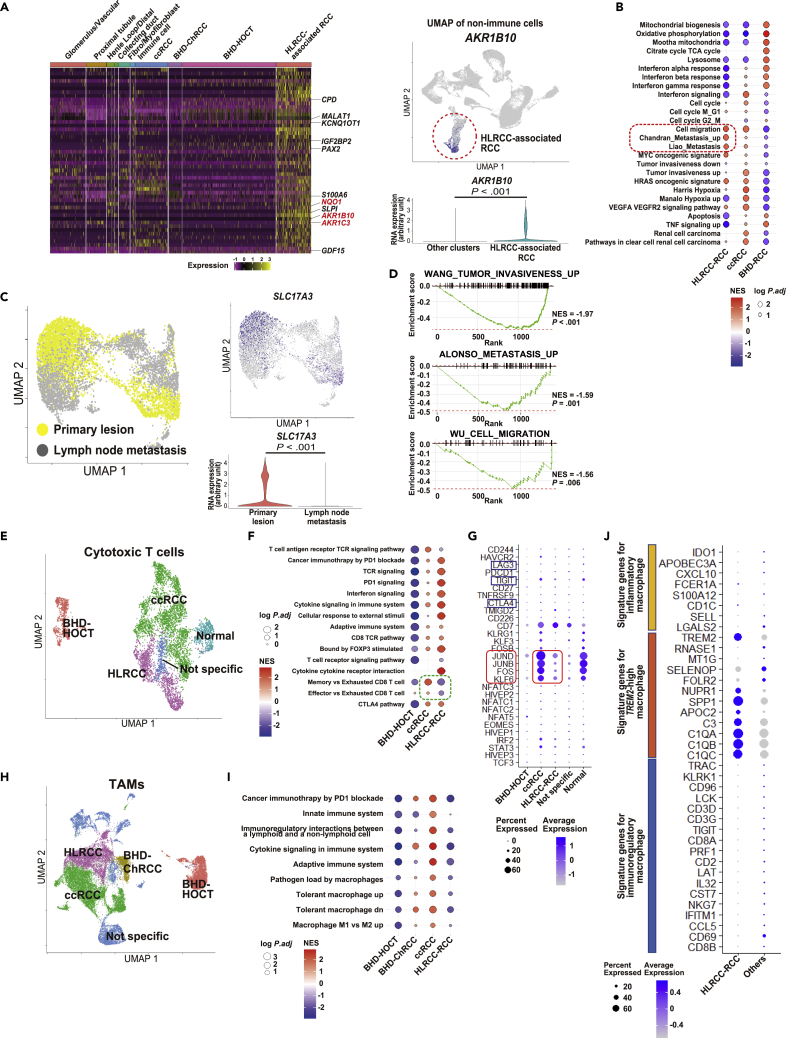
Our understanding of how each hereditary kidney cancer adapts to its tissue microenvironment is incomplete. Here, we present single-cell transcriptomes of 108,342 cells from patient specimens including from six hereditary kidney cancers. The transcriptomes displayed distinct characteristics of the cell of origin and unique tissue microenvironment for each hereditary kidney cancer. Of note, hereditary leiomyomatosis and renal cell carcinoma (HLRCC)-associated kidney cancer retained some characteristics of proximal tubules, which were completely lost in lymph node metastases and present as an avascular tumor with suppressed T cells and TREM2-high macrophages, leading to immune tolerance. Birt-Hogg-Dubé (BHD)-associated kidney cancer exhibited transcriptomic intratumor heterogeneity (tITH) with increased characteristics of intercalated cells of the collecting duct and upregulation of FOXI1-driven genes, a critical transcription factor for collecting duct differentiation. These findings facilitate our understanding of how hereditary kidney cancers adapt to their tissue microenvironment.

Keywords: Cancer; Cancer systems biology; Human specimen; Microenvironment; Oncology.


Conflict of interest statement

The authors declare no competing interests.

Figures

None
Graphical abstract
Figure 1
Figure 1
Single-cell transcriptome exhibits an association of each hereditary kidney cancer with its cell of origin (A) Computed tomography and hematoxylin-eosin staining of kidney cancers analyzed in this study. Arrows indicate tumors. Image shows a 400× magnification of hematoxylin and eosin staining. Scale bars represent 50 μm. (B) Clinical information and somatic variants identified by whole exome sequencing. (C) Uniform manifold approximation and projection (UMAP) plots of cells from two normal kidneys (left) and those from ten kidney cancers (right). (D) UMAP plots of CD45 positive immune cells (left) and CD45 negative nonimmune cells (right) from twelve specimens. (E) UMAP plot of CD45 negative nonimmune cells from all twelve specimens annotated with gene markers, whose expressions are shown in surrounding figures and Figure S1F. Some residual immune cells which are seen as dark purple dots in CD45 negative cluster 0, 2, 3, 4, 6, 10, 12, 13, 15, 17, 22, 23, and 25 in the upper panel of Figure S1C were re-clustered as immune cells. Abbreviations: BHD-ChRCC, BHD-associated chromophobe renal cell carcinoma; BHD-HOCT, BHD-associated hybrid oncocytic chromophobe tumor; ccRCC, clear cell renal cell carcinoma; HLRCC-LN, lymph node metastasis of HLRCC-associated kidney cancer; HLRCC-Prim, primary lesion of HLRCC-associated kidney cancer; s-ccRCC, sporadic clear cell renal cell carcinoma.
Figure 2
Figure 2
Single-cell transcriptome delineates characteristic tissue microenvironment of each hereditary kidney cancer (A) Bar plot of cell type composition. Horizontal axis means ratio of cell number of each cell type per total cell number in each specimen. TAM, tumor-associated macrophage. (B) Predicted cell type composition of 539 ccRCC samples from The Cancer Genome Atlas (TCGA) project using deconvolution pipelines. (C) Overall survival of 539 ccRCC patients from TCGA project based on predicted cell type composition. Patients were divided into two groups by the median ratio of cell number of each cell type per total cell number. p values from 2-sided log rank test, and the hazard ratio with 95% confidence interval is shown. (D) Predicted cell type composition of 16 BHD-associated kidney cancers using deconvolution pipelines. (E) UMAP plot of vascular cells from all of the twelve specimens. The cell number in each cluster is as follows: 462 vascular cells for BHD-ChRCC, 1,181 vascular cells for BHD-HOCT, 4,920 vascular cells for ccRCC, 1,462 vascular cells for normal kidney (Normal), and 1,081 vascular cells for nonspecific cluster (Not specific) cells. (F) Gene Set Enrichment Analysis (GSEA) comparing vascular cells of BHD-HOCT, BHD-ChRCC, and ccRCC (VHL-associated and sporadic). Abbreviations: BHD-ChRCC, BHD-associated chromophobe renal cell carcinoma; BHD-HOCT, BHD-associated hybrid oncocytic chromophobe tumor; ccRCC, clear cell renal cell carcinoma; ChRCC, chromophobe renal cell carcinoma; HLRCC-LN, lymph node metastasis of HLRCC-associated kidney cancer; HLRCC-Prim, primary lesion of HLRCC-associated kidney cancer; HOCT, hybrid oncocytic chromophobe tumor; HR, hazard ratio; s-ccRCC, sporadic clear cell renal cell carcinoma; TAM, tumor associated macrophage; Unclassified, unclassified renal cell carcinoma.
Figure 3
Figure 3
HLRCC-associated kidney cancer harbors suppressed T cells and TREM2-high tumor associated macrophages (TAMs) (A) Heatmap of top 50 highly expressed genes in HLRCC-associated kidney cancer. Red highlighted genes are associated with the KEAP1-NRF2 axis (left). Expression of AKR1B10, one of the known genes associated with KEAP1-NRF2 axis, on the UMAP plot and violin plot of non-immune cells in all the tumors (right). p values are from 2-sided Welch’s two sample t-tests. (B) GSEA results comparing tumor cells of HLRCC-associated kidney cancer (HLRCC-RCC), ccRCC (VHL-associated and sporadic), and BHD-associated kidney cancers (BHD-RCC). (C) UMAP plot of tumor cells from primary lesion and lymph node metastasis of HLRCC-associated kidney cancer (left). Expressions of SLC17A3, a proximal tubule marker in the left UMAP plot (right). (D) GSEA results comparing tumor cells of primary lesion and those of lymph node metastasis of HLRCC-associated kidney cancer. (E) UMAP plot of cytotoxic T cells from all twelve specimens colored by each group. The cell number in each cluster is as follows: 725 cytotoxic T cells for BHD-HOCT, 3,101 cytotoxic T cells for ccRCC (VHL-associated and sporadic), 1,357 cytotoxic T cells for HLRCC, 576 cytotoxic T cells for normal kidney (Normal), and 365 cytotoxic T cells for non-specific cluster (Not specific). (F) GSEA results comparing cytotoxic T cells of BHD-HOCT, ccRCC, and HLRCC-RCC. (G) Dot plot of marker genes for T cell homeostasis and differentiation (red squared genes) and T cell exhaustion markers (blue squared genes). (H) UMAP plot of TAMs from all twelve specimens colored by each group. The cell number in each cluster is as follows: 1,737 TAMs for BHD-ChRCC, 4,625 TAMs for BHD-HOCT, 9,213 TAMs for ccRCC, 5,395 TAMs for HLRCC, and 6,234 TAMs for nonspecific cell cluster (Not specific). (I) GSEA results comparing TAMs of BHD-HOCT, BHD-associated chromophobe renal cell carcinoma (BHD-ChRCC), ccRCC (VHL-associated and sporadic), and HLRCC-RCC. (J) Dot plot of signature gene expressions for various types of macrophages. Others include BHD-associated kidney cancers and ccRCC (VHL-associated and sporadic). Abbreviations: BHD-ChRCC, BHD-associated chromophobe renal cell carcinoma; BHD-HOCT, BHD-associated hybrid oncocytic chromophobe tumor; BHD-RCC, BHD-associated renal cell carcinoma; ccRCC, clear cell renal cell carcinoma; HLRCC-RCC, HLRCC-associated renal cell carcinoma; s-ccRCC, sporadic clear cell renal cell carcinoma; TAM, tumor associated macrophage.
Figure 4
Figure 4
BHD-associated kidney cancer exhibits a transcriptomic intratumor heterogeneity (tITH) and increased intercalated cell characteristics with upregulated FOXI1-driven genes (A) UMAP plots of tumor cells of BHD-associated HOCT (BHD-HOCT) and chromophobe renal cell carcinoma (BHD-ChRCC) colored by expressions of each gene. Yellow colored cells express both genes. (B) UMAP plot of tumor in each cell of BHD-ChRCC and BHD-HOCT divided into two clusters; a cluster of L1CAM expressing cells (cL1CAM) and that of FOXI1 expressing cells (cFOXI1) (left). Bubble chart of expressions of marker genes for intercalated cell (IC) and principal cell (PC) in each cluster; normal cell atlas was created using transcriptomes of two normal kidneys in this study and expressions of top thirteen marker genes from our normal cell atlas are indicated (right) (Figure S3 and Dataset S3). (C) Trajectory analysis of BHD-associated HOCT and benign collecting duct (right). For this trajectory analysis, clusters in Figure 4B were further narrowed down (confined) in accordance with an upper limit of our PC processing speed; a confined cluster of L1CAM expressing cells (ccL1CAM) and a confined cluster of FOXI1 expressing cells (ccFOXI1) (left). (D) Gradient expressions of FOXI1 and its downstream genes in the trajectory of Figure 4C. (E) FOXI1 expressions in the trajectory of Figure 4C. (F) Violin plots of FOXI1 and its downstream gene expressions in each cluster. p values from 2-sided Welch’s two sample t-test. (G) Boxplot of FOXI1 and its downstream gene expressions. N, normal kidney (n = 5). T, BHD-associated kidney cancer (n = 16). p values from 2-sided Welch’s two sample t-test. (H) Bubble chart of expressions of marker genes for benign nephron cells in benign nephron cells and tumors; expressions of top ten marker genes from our normal cell atlas are shown (Figure S3 and Dataset S3). Abbreviations: BHD-ChRCC, BHD-associated chromophobe renal cell carcinoma; BHD-HOCT, BHD-associated hybrid oncocytic chromophobe tumor; ccFOXI1, confined cluster of FOXI1 expressing cells; ccL1CAM, confined cluster of L1CAM expressing cells; ccRCC, clear cell renal cell carcinoma; cFOXI1, cluster of FOXI1 expressing cells; cL1CAM, cluster of L1CAM expressing cells; HLRCC, HLRCC-associated kidney cancer; IC, intercalated cell; N, normal kidney; PC, principal cell; T, BHD-associated kidney cancer.
Figure 5
Figure 5
Differentially expressed genes (DEGs) analysis highlights novel markers and a potential therapeutic target for BHD-associated kidney cancer (A) Bubble chart of differentially expressed genes (DEGs) between BHD-associated HOCT (BHD-HOCT) and BHD-associated chromophobe renal cell carcinoma (BHD-ChRCC). Top twenty-five DEGs in each group are shown. (B) MA plot of DEGs between four BHD-HOCTs and nine BHD-ChRCCs bulk RNA-seq datasets. (C) UMAP plot of nonimmune cells from all of twelve specimens colored with MET expressions. The red dotted circle surrounds BHD-associated kidney cancer cells (upper panel). Violin plots of MET expressions in BHD-associated kidney cancers and other specimens (lower panel). p values from 2-sided Welch’s two sample t-test. (D) Heatmap of gene expressions in normal kidneys (n = 5) and BHD-associated kidney cancers (n = 16). (E) Boxplots of gene expressions shown in Figure 5D. N, normal kidney (n = 5). T, BHD-associated kidney cancer (n = 16). p values from 2-sided Welch’s two sample t-test. (F) Immunohistochemistry of MET protein in BHD-associated kidney cancers. Scale bars represent 200 μm. Abbreviations: BHD-ChRCC, BHD-associated chromophobe renal cell carcinoma; BHD-HOCT, BHD-associated hybrid oncocytic chromophobe tumor; ChRCC, chromophobe renal cell carcinoma; ccRCC, clear cell renal cell carcinoma; DEGs, differentially expressed genes; HOCT, hybrid oncocytic chromophobe tumor; N, normal kidney; T, BHD-associated kidney cancer; Unclassified, unclassified renal cell carcinoma.

References

    1. Aird W.C. Phenotypic heterogeneity of the endothelium: II. Representative vascular beds. Circ. Res. 2007;100:174–190. doi: 10.1161/01.res.0000255690.03436.ae. - DOI - PubMed
    1. Ball M.W., An J.Y., Gomella P.T., Gautam R., Ricketts C.J., Vocke C.D., Schmidt L.S., Merino M.J., Srinivasan R., Malayeri A.A., et al. Growth rates of genetically defined renal tumors: implications for active surveillance and intervention. J. Clin. Oncol. 2020;38:1146–1153. doi: 10.1200/jco.19.02263. - DOI - PMC - PubMed
    1. Ball M.W., Shuch B.M. Inherited kidney cancer syndromes. Curr. Opin. Urol. 2019;29:334–343. doi: 10.1097/mou.0000000000000646. - DOI - PubMed
    1. Barone S., Zahedi K., Brooks M., Henske E.P., Yang Y., Zhang E., Bissler J.J., Yu J.J., Soleimani M. Kidney intercalated cells and the transcription factor FOXi1 drive cystogenesis in tuberous sclerosis complex. Proc. Natl. Acad. Sci. U S A. 2021;118 doi: 10.1073/pnas.2020190118. - DOI - PMC - PubMed
    1. Cancer Genome Atlas Research Network Comprehensive molecular characterization of clear cell renal cell carcinoma. Nature. 2013;499:43–49. doi: 10.1038/nature12222. - DOI - PMC - PubMed

LinkOut - more resources