. 2022 Jul 7:12:933210.
doi: 10.3389/fonc.2022.933210. eCollection 2022.

Computational Characterizing Necroptosis Reveals Implications for Immune Infiltration and Immunotherapy of Hepatocellular Carcinoma

Affiliations

Computational Characterizing Necroptosis Reveals Implications for Immune Infiltration and Immunotherapy of Hepatocellular Carcinoma

Jun Zhu et al. Front Oncol. .

Abstract

Necroptosis is a programmed form of necrotic cell death in regulating cancer ontogenesis, progression, and tumor microenvironment (TME) and could drive tumor-infiltrating cells to release pro-inflammatory cytokines, incurring strong immune responses. Nowadays, there are few identified biomarkers applied in clinical immunotherapy, and it is increasingly recognized that high levels of tumor necroptosis could enhance the response to immunotherapy. However, comprehensive characterization of necroptosis associated with TME and immunotherapy in Hepatocellular carcinoma (HCC) remains unexplored. Here, we computationally characterized necroptosis landscape in HCC samples from TCGA and ICGA cohorts and stratified them into two necroptosis clusters (A or B) with significantly different characteristics in clinical prognosis, immune cell function, and TME-landscapes. Additionally, to further evaluate the necroptosis levels of each sample, we established a novel necroptosis-related gene score (NRGscore). We further investigated the TME, tumor mutational burden (TMB), clinical response to immunotherapy, and chemotherapeutic drug sensitivity of HCC subgroups stratified by the necroptosis landscapes. The NRGscore is robust and highly predictive of HCC clinical outcomes. Further analysis indicated that the high NRGscore group resembles the immune-inflamed phenotype while the low score group is analogous to the immune-exclusion or metabolism phenotype. Additionally, the high NRGscore group is more sensitive to immune checkpoint blockade-based immunotherapy, which was further validated using an external HCC cohort, metastatic melanoma cohort, and advanced urothelial cancer cohort. Besides, the NRGscore was demonstrated as a potential biomarker for chemotherapy, wherein the high NRGscore patients with more tumor stem cell composition could be more sensitive to Cisplatin, Doxorubicin, Paclitaxel-based chemotherapy, and Sorafenib therapy. Collectively, a comprehensive characterization of the necroptosis in HCC suggested its implications for predicting immune infiltration and response to immunotherapy of HCC, providing promising strategies for treatment.

Keywords: necroptosis; chemotherapy; hepatocellular carcinoma; immunotherapy; tumor microenvironment; tumor-infiltrating cells.


Conflict of interest statement

The authors declare that the research was conducted in the absence of any commercial or financial relationships that could be construed as a potential conflict of interest.

Figures
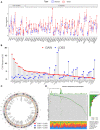
Figure 1
Figure 1
Genetic landscape and expression variation of necroptosis regulators in HCC. (A) The differential expression level of necroptosis regulators between tumor and normal tissues. (B) CNV alternation of necroptosis regulators in tumor tissues. Column represented the frequency of the variations. The green dot represented the deletion of CNV. The red dot represented the amplification of CNV. (C) Location of CNV of necroptosis regulators in chromosomes. Red dots represent genes gain than loss, blue dot presents genes loss than gain and the black dot means loss equal gain. (D) One hundred eight patients (29.67%) exhibited various genetic alterations, including missense, nonsense, splice, frameshift, and multiple mutations. Each column indicated individual HCC patients, and the upper bar diagram exhibited the TMB of HCC patients. The right number represented the mutation frequency, and the bar diagram on the right exhibited the proportion of each genetic alteration. P < 0.05 *; P < 0.01**; P < 0.001***. HCC, hepatocellular carcinoma; CNV, copy number variation; TMB, tumor mutation burden.
Figure 2
Figure 2
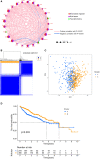
Unsupervised clustering of necroptosis regulators. (A) Interaction network of necroptosis regulators in HCC. Necroptosis regulators were indicated by red circles. Risk factors were indicated by purple circles, and favorable factors were indicated by green circles. Different sizes of the circle represented the different P-values. Red lines showed the positive correlation, and blue lines showed the negative correlation. (B) Consensus clustering matrix for k =2. (C) The feature distribution between different two Nclusters was plotted via PCA. (D) Kaplan-Meier curves of the OS for the two Nclusters of HCC patients. Ncluster, necroptosis cluster; PCA, principal component analysis; OS, overall survival; HCC, hepatocellular carcinoma.
Figure 3
Figure 3
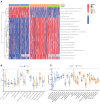
Dramatic difference of biological features between Ncluster A and B. (A) Heatmap showed various KEGG pathways were enriched in Ncluster A and B. (B) Immune function and infiltrating immune cells (C) altered in two Nclusters shown by violin diagram. The heatmap was used to visualize these biological processes, and red represented activated pathways and blue represented inhibited pathways. Ncluster, necroptosis cluster.
Figure 4
Figure 4
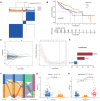
Identification of necroptosis genomic classification and construction of NRGscore. (A) Consensus clustering matrix for k =3. (B) Kaplan-Meier curves indicated necroptosis genomic phenotypes were markedly related to the OS of 599 patients in TCGA and ICGC cohorts, of which 203 cases were in gene cluster A, 321 cases in gene cluster B, and 75 cases in gene cluster C. (C) The partial likelihood deviance plot. (D) The Lasso regression coefficient profiles. (E) Coefficient of three core necroptosis-related DEGs. (F) The alluvial diagram exhibited the correlation of Ncluster, NRGcluster, NRGscore, and survival status. (G) Differences in NRGscore between two Nclusters in TCGA and ICGC cohorts. The upper and lower ends of the boxes represented the interquartile range of values. The lines in the boxes represented median value, and dots showed outliers. (H) Differences in NRGscore among three NRGclusters in TCGC and ICGC cohorts. P < 0.05 *; P < 0.01**; P < 0.001***. NRGscore, necroptosis-related gene score; OS, overall survival; TCGA, the cancer genome atlas; ICGC, international cancer genome consortium; Lasso, least absolute shrinkage and selection operator; DEGs, differentially expressed genes; Ncluster, necroptosis cluster; NRGclusters, necroptosis-related genes clusters.
Figure 5
Figure 5
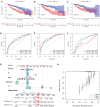
Evaluation of predictive power of NRGscore in training and test cohorts. (A, C) Kaplan-Meier curves showed that the high NRGrisk group had a more inferior OS than the low NRGrisk group in TCGA and ICGC cohorts, of which 599 cases were in the overall set (A), 300 cases were in training set (B), and 299 cases were in the test set (C). (D-F) ROC of NRGscore scheme: Areas under the curve of 1-, 3-, and 5-year OS in the overall set (D), training set (E), and test set (F). (G) Nomogram predicting 1-, 3-, and 5- year OS of patients based on NRGscore and other clinical parameters, including gender, age, T stage, and N stage. The red dot presented the point of each parameter, and the length of the line segment reflected the contribution of factors to the outcome event. (H) Calibration plot of the nomogram for predicting the probability of 1-, 3-, and 5-year OS. The colored line was the fit line and represented the predicted value (the horizontal axis) corresponding to the actual value (the vertical axis). The gray diagonal was the ideal case. P < 0.01**; P < 0.001***. TCGA, the cancer genome atlas; ICGC, international cancer genome consortium; NRGscore, necroptosis-related gene score; NRGrisk, necroptosis-related gene risk; ROC, receiver operating characteristic curves; OS, overall survival.
Figure 6
Figure 6
NRGscore could accurately predict response to ICBs. (A) Different biological features in high and low NRGrisk groups by GSEA in KEGG pathways. (B) Violin diagrams exhibited the correlation of immune, stromal, and ESTIMATE scores with NRGrisk groups. (C) Heatmap indicated the relevance of TICs and three hub genes in NRGscore. Different colors represented the different degrees of correlation. (D) T cell exclusion score was positively associated with NRGscore in the GSE54236 HCC cohort. (E) Waterfall diagram of NRGscore with responder or non-responder to CTLA-4 cohort. (F) Patients who respond to ICB possess more NRGscore than non-responders in the TCGA cohort by the TIDE algorithm. (G) NRGscore of patients varied with different responses to immunotherapy in the advanced urothelial cancer cohort. CR/PR is short for complete response or partial response; SD/PD represented the stable disease or progressive disease. P < 0.05 *; P < 0.01**; P < 0.001***. ICBs, immune checkpoint blockades; NRGscore, necroptosis-related gene score; TICs, tumor-infiltrating cells; NRGrisk, necroptosis-related gene risk; TIDE, tumor immune dysfunction, and exclusion.
Figure 7
Figure 7
Characteristics of NRGscore with tumor somatic mutation, stem cell, and chemotherapy sensitivity. (A, B) The waterfall plot of tumor somatic mutation was drawn in those with high NRGrisk group (A) and low NRGrisk (B) respectively. Each column indicated individual HCC patients, and the upper bar diagram exhibited TMB. The right number represented the mutation frequency, and the bar diagram on the right exhibited the proportion of each variant type, including missense, nonsense, splice, frameshift, and multiple mutations. (C) Correlation between NRGscore and component of stem cell. (D-H) Box diagrams showed the chemotherapy response between high NRGrisk and low NRGrisk groups: (D) Cisplatin, (E) Camptothecin, (F) Doxorubicin, (G) Paclitaxel, (H) Sorafenib. NRGscore, necroptosis-related gene score; NRGrisk, necroptosis-related gene risk; HCC, hepatocellular carcinoma; TMB, tumor mutation burden; IC50, half-maximal inhibitory concentration.

Similar articles

Cited by

References

    1. Bray F, Ferlay J, Soerjomataram I, Siegel RL, Torre LA, Jemal A. Global Cancer Statistics 2018: GLOBOCAN Estimates of Incidence and Mortality Worldwide for 36 Cancers in 185 Countries. CA Cancer J Clin (2018) 68:394–424. doi: 10.3322/caac.21492 - DOI - PubMed
    1. Kulik L, El-Serag HB. Epidemiology and Management of Hepatocellular Carcinoma. Gastroenterology (2019) 156:477–491.e1. doi: 10.1053/j.gastro.2018.08.065 - DOI - PMC - PubMed
    1. Singal AG, Lampertico P, Nahon P. Epidemiology and Surveillance for Hepatocellular Carcinoma: New Trends. J Hepatol (2020) 72:250–61. doi: 10.1016/j.jhep.2019.08.025 - DOI - PMC - PubMed
    1. McGlynn KA, Petrick JL, El-Serag HB. Epidemiology of Hepatocellular Carcinoma. Hepatol (Baltimore Md.) (2021) 73(Suppl 1):4–13. doi: 10.1002/hep.31288 - DOI - PMC - PubMed
    1. Amin MB, Greene FL, Edge SB, Compton CC, Gershenwald JE, Brookland RK, et al. . The Eighth Edition AJCC Cancer Staging Manual: Continuing to Build a Bridge From a Population-Based to a More "Personalized" Approach to Cancer Staging. CA: Cancer J Clin (2017) 67:93–9. doi: 10.3322/caac.21388 - DOI - PubMed

LinkOut - more resources