. 2022 Jul 7:12:915319.
doi: 10.3389/fonc.2022.915319. eCollection 2022.

3D Ultrasound-Guided Photoacoustic Imaging to Monitor the Effects of Suboptimal Tyrosine Kinase Inhibitor Therapy in Pancreatic Tumors

Affiliations

3D Ultrasound-Guided Photoacoustic Imaging to Monitor the Effects of Suboptimal Tyrosine Kinase Inhibitor Therapy in Pancreatic Tumors

Abigail Claus et al. Front Oncol. .

Abstract

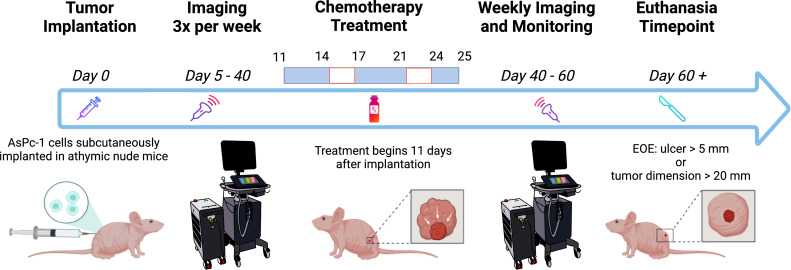
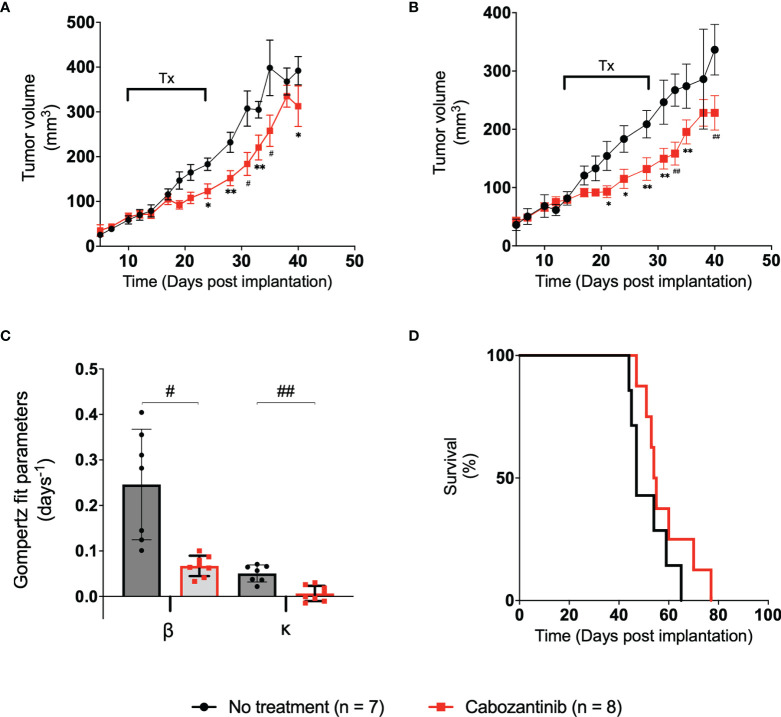
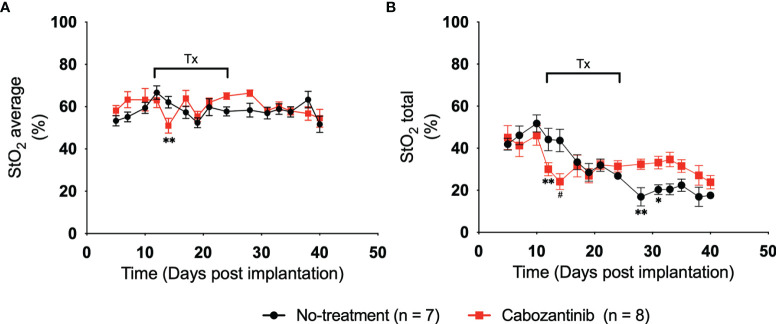
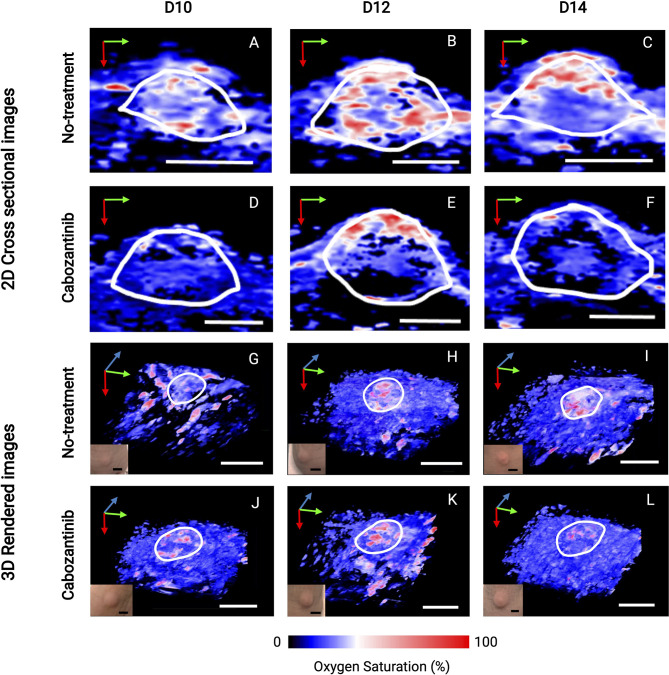
Pancreatic cancer is a disease with an incredibly poor survival rate. As only about 20% of patients are eligible for surgical resection, neoadjuvant treatments that can relieve symptoms and shrink tumors for surgical resection become critical. Many forms of treatments rely on increased vulnerability of cancerous cells, but tumors or regions within the tumors that may be hypoxic could be drug resistant. Particularly for neoadjuvant therapies such as the tyrosine kinase inhibitors utilized to shrink tumors, it is critical to monitor changes in vascular function and hypoxia to predict treatment efficacy. Current clinical imaging modalities used to obtain structural and functional information regarding hypoxia or oxygen saturation (StO2) do not provide sufficient depth penetration or require the use of exogenous contrast agents. Recently, ultrasound-guided photoacoustic imaging (US-PAI) has garnered significant popularity, as it can noninvasively provide multiparametric information on tumor vasculature and function without the need for contrast agents. Here, we built upon existing literature on US-PAI and demonstrate the importance of changes in StO2 values to predict treatment response, particularly tumor growth rate, when the outcomes are suboptimal. Specifically, we image xenograft mouse models of pancreatic adenocarcinoma treated with suboptimal doses of a tyrosine kinase inhibitor cabozantinib. We utilize the US-PAI data to develop a multivariate regression model that demonstrates that a therapy-induced reduction in tumor growth rate can be predicted with 100% positive predictive power and a moderate (58.33%) negative predictive power when a combination of pretreatment tumor volume and changes in StO2 values pretreatment and immediately posttreatment was employed. Overall, our study indicates that US-PAI has the potential to provide label-free surrogate imaging biomarkers that can predict tumor growth rate in suboptimal therapy.

Keywords: blood oxygen saturation; hypoxia; neoadjuvant therapy; pancreatic cancer; photoacoustic imaging; suboptimal therapy; treatment prediction; tyrosine kinase inhibitor.


Conflict of interest statement

The authors declare that the research was conducted in the absence of any commercial or financial relationships that could be construed as a potential conflict of interest.

Figures

Figure 1
Figure 1
Schematic of the experiment timeline. The mice were imaged frequently before and during chemotherapy treatment. Weekly imaging ensued 40 days after tumor implantation through the end of the experiment (EOE). Created with Biorender.com.
Figure 2
Figure 2
A flowchart depicting the steps involved in collecting and analyzing relevant data in our experiment. Inputs consist of StO2, HbT (from photoacoustic images), and tumor volume (extracted from ultrasound images). Tumor volume gathered from ultrasound images was plotted for various days post-implantation. The data were fitted with the Gompertz growth model. Shown in the bottom left schematic representation is the area under the curve (AUC) for different time periods during the study. AUCEarly (orange shaded area) is area under the volume vs. time plot during the pretreatment days (D5–D10). AUCTreat (green shaded region) represented the AUC for time period D11–D26 when the mice were treated with cabozantinib. AUCLate (blue shaded region) is the AUC for time period D26–D40. AUC parameters units are mm3 * day. The bottom right image is a schematic representation of the tumor volume vs. days post-implantation curve utilized to determine the 2×, 5×, and 10× growth parameters. 2× is the number of days it takes for a tumor’s pretreatment (D5) volume to double in size. Green (5×) and blue (10×) show the number of days it takes for pretreatment volume to increase by factors of 5 and 10, respectively. X-fold increase parameters are measured in terms of days post-implantation. PA and US represent photoacoustic and ultrasound, respectively. Created with Biorender.com.
Figure 3
Figure 3
(A) Plot of tumor volume obtained from ultrasound images vs. the time post-tumor implantation. The treatment days are indicated with a bar labeled “Tx.” (B) Plot of tumor volume measured with digital calipers vs. days post-tumor implantation. Error bars represent the SEM for each of the groups on a particular day. (C) Bar plot of the spread of each group’s Gompertz growth rates. Error bars represent SEM, where n = 8 for each group. (D) Kaplan–Meier survival curve of the two groups over the period of the study. Median survival time for control and treated groups was 47.5 and 54.5 days, respectively. * p < 0.05, ** p < 0.01, # p < 0.001, ## p < 0.0001.
Figure 4
Figure 4
(A) Plot of 3D average StO2 in the tumors on different days post-implantation. Three days after treatment initiation, there is a statistically relevant difference between treated and non-treated tumors with a p-value of 0.0091. Error bars represent standard error of the mean (SEM) for each day post-implantation. (B) Plot of 3D total StO2 on different days post-implantation. By performing multiple two-tailed unpaired t-tests, both 24 and 72 h posttreatment have significant differences between the values, with p-values of 0.0083 and 0.0003, respectively. Error bars represent SEM. * p < 0.05, ** p < 0.01, # p < 0.001.
Figure 5
Figure 5
2D cross-sectional photoacoustic images (A–F) and corresponding 3D rendered images (G–L) of tumor regions from the day before the first administration of treatment (D10) immediately through the first 72 h after the start of treatment (D14). Post-administration of cabozantinib, we observe a decrease in StO2 from D12 to D14, while the Control (no-treatment) group had relatively similar StO2. Insets shown in the lower left corner of 3D images are photographs of tumors taken immediately before the corresponding PAI acquisition. The tumor volume change at these time points is not statistically significant, indicated also by the no obvious changes seen in the photographs of the tumors. In upper 2D cross-sectional images, scale bars = 2 mm. In lower 3D rendered images, both black and white, scale bars = 5 mm. Green, blue, and red arrows indicate the x-, y-, and z-direction, respectively.
Figure 6
Figure 6
Spearman correlation matrix comparing the tumor growth characteristics and tumor StO2 parameters. Tumor growth parameters include pretreatment volume, Gompertz function parameters (α, β, and κ), area under the growth curve obtained pretreatment (AUCEarly), during treatment (AUCTreat), posttreatment (AUCLate), and time taken for the tumors to reach twice (2×), 5 times (5×), and 10 times (10×) their pretreatment volume. The StO2 parameters include the 3D StO2 average values on Days 7, 10, 12, and 14 post-implantation (D7, D10, D12, and D14, respectively) and parameters describing the change in StO2 from Day 7 to Day 10 (D7–D10), Day 10 to Day 12 (D10–D12), and Day 10 to Day 14 (D10–D14). Color gradient assists in identifying the most prominent parameter relationships, with red representing a positive correlation coefficient and violet representing a negative correlation coefficient.
Figure 7
Figure 7
Scatter bubble plot of change in StO2 values between D10 and D14 vs. tumor growth rate β values. The change in StO2 from D7 to D10 is indicated by the color bar where a decrease in oxygenation is represented by red, while an increase in oxygenation is represented by blue. The size of the bubbles is representative of the pretreatment volume of the tumors on D10. The label 0 indicates tumors in the control group, while 1 corresponds to treated.
Figure 8
Figure 8
Representative data from the k-fold cross-validation of the multivariate linear regression model given by the Equation: Growth rate β = b 0+ b 1∗ pretreatmentvolumeb 2 ∗ StO 2(D7−D10) +b 3StO 2(D10−D14) . The training data set is represented by green squares (n = 24), the representative regression line in black, and the validation data set is represented by blue circles (n = 5).
Figure 9
Figure 9
Receiver operating characteristic curve showcasing the predictive capability of various parameters used in the multiple logistic regression analysis. The model created with Pretreatment volume and change in StO2 between D7–D10 and D10–D14 had the highest AUC. The line of identity is shown as a gray dotted line.

Similar articles

Cited by

References

    1. Siegel RL, Miller KD, Fuchs HE, Jemal A. Cancer Statistics, 2021. CA: A Cancer J Clin (2021) 71(1):7–33. doi: 10.3322/caac.21654 - DOI - PubMed
    1. Oba A, Ho F, Bao QR, Al-Musawi MH, Schulick RD, Del Chiaro M. Neoadjuvant Treatment in Pancreatic Cancer. Front Oncol (2020) 10:245. doi: 10.3389/fonc.2020.00245 - DOI - PMC - PubMed
    1. Chawla A, Ferrone CR. Neoadjuvant Therapy for Resectable Pancreatic Cancer: An Evolving Paradigm Shift. Front Oncol (2019) 9(1085). doi: 10.3389/fonc.2019.01085 - DOI - PMC - PubMed
    1. Stylianopoulos T, Munn LL, Jain RK. Reengineering the Physical Microenvironment of Tumors to Improve Drug Delivery and Efficacy: From Mathematical Modeling to Bench to Bedside. Trends Cancer (2018) 4(4):292–319. doi: 10.1016/j.trecan.2018.02.005 - DOI - PMC - PubMed
    1. Jain RK. Normalization of Tumor Vasculature: An Emerging Concept in Antiangiogenic Therapy. Sci (Amer Assoc Adv Science). (2005) 307(5706):58–62. doi: 10.1126/science.1104819 - DOI - PubMed