. 2022 Jun:2:896295.
doi: 10.3389/fbinf.2022.896295. Epub 2022 Jun 2.

ContactPFP: Protein function prediction using predicted contact information

Affiliations

ContactPFP: Protein function prediction using predicted contact information

Yuki Kagaya et al. Front Bioinform. 2022 Jun.

Abstract

Computational function prediction is one of the most important problems in bioinformatics as elucidating the function of genes is a central task in molecular biology and genomics. Most of the existing function prediction methods use protein sequences as the primary source of input information because the sequence is the most available information for query proteins. There are attempts to consider other attributes of query proteins. Among these attributes, the three-dimensional (3D) structure of proteins is known to be very useful in identifying the evolutionary relationship of proteins, from which functional similarity can be inferred. Here, we report a novel protein function prediction method, ContactPFP, which uses predicted residue-residue contact maps as input structural features of query proteins. Although 3D structure information is known to be useful, it has not been routinely used in function prediction because the 3D structure is not experimentally determined for many proteins. In ContactPFP, we overcome this limitation by using residue-residue contact prediction, which has become increasingly accurate due to rapid development in the protein structure prediction field. ContactPFP takes a query protein sequence as input and uses predicted residue-residue contact as a proxy for the 3D protein structure. To characterize how predicted contacts contribute to function prediction accuracy, we compared the performance of ContactPFP with several well-established sequence-based function prediction methods. The comparative study revealed the advantages and weaknesses of ContactPFP compared to contemporary sequence-based methods. There were many cases where it showed higher prediction accuracy. We examined factors that affected the accuracy of ContactPFP using several illustrative cases that highlight the strength of our method.

Keywords: PFP; contact prediction; function annotation; function prediction; functional genomics; gene function; protein structure; residue contacts.


Conflict of interest statement

The authors declare that the research was conducted in the absence of any commercial or financial relationships that could be construed as a potential conflict of interest.

Figures

FIGURE 1
FIGURE 1
Overview of ContactPFP. From an input protein sequence, residue-residue contact information is predicted with trRosetta, which is represented as a graph. Then, the graph is compared with contact map graphs in a database using GR-Align. Proteins in the database are sorted by graph similarity to the query and GO terms are extracted from top hits.
FIGURE 2
FIGURE 2
Influence of parameters on the prediction performance of ContactPFP. Parameters were examined that determine the definition of hits in the contact map database search. The y-axis shown is the average Fmax score computed for the four test sets in the four-fold cross validation. In each plot, three distance cutoffs, 8, 10, 12 Å, were used that defined residue contacts. The bar indicates the standard deviation calculated from four-fold cross validation. (A) Raw contact map graph comparison score. From a database search result, we only considered retrieved proteins with a specified graph similarity score or higher. The average standard deviation was 0.002. (B) Selecting top N hits by the raw score. In this scheme, we only selected top N hits as specified on the x-axis regardless of their scores. The average standard deviation was 0.002. (C) Z-score of the contact map graph comparison score. In this scheme, we chose hits to consider by the Z-score of the graph similarity score relative to the score distribution of the entire reference database. The average standard deviation was 0.002.
FIGURE 3
FIGURE 3
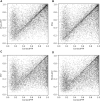
Comparison of Fmax score of individual target proteins. To be precise, they are F-score of each protein using the score cutoff that yielded the Fmax score of the benchmark dataset. Each point represents a protein in the benchmark dataset. (A) Comparison between ContactPFP and Phylo-PFP; (B) Comparison between ContactPFP and ESG; (C) comparison between ContactPFP and PFP; (D) Comparison between ContactPFP vs. PSI-BLAST.
FIGURE 4
FIGURE 4
Function prediction accuracy relative to structural features of target proteins. (A) and (B), Fmax score of ContactPFP relative to the precision of contact prediction. Each point is corresponding to a protein which has an experimentally determined structure. There were 1,029 proteins of them. (A) Fmax score relative to the precision of all predicted contacts. Contacts are defined for residue pairs that have a Cβ distance within 12 Å from each other. The average precision was 0.801. (B) Fmax score relative to the precision when we considered the top L/5 predicted long-range contacts, which were defined as contacts that are 24 residues or more apart on the sequence. L is the length of a protein. Contacts were defined as residue pairs that have their Cβ atoms placed within 8 Å. The average precision L/5 long precision was 0.908. (C) Comparison of the performance between ContactPFP using predicted contacts and ContactPFP that uses accurate contacts taken from the experimentally determined structures. Contacts are defined for residue pairs that have Cβ atoms within 12 Å from each other. Fmax scores of the 1,029 targets that have PDB structures were compared. (D) The effect of the fraction of disordered regions in proteins to the Fmax score. We used fldpnn to predict residues in disordered regions.
FIGURE 5
FIGURE 5
GO prediction by ContactPFP for outer membrane porin G (P76045). The first three panels (A–C) and the subsequent panels in the second row (D–F) are predicted residue contacts and resulting protein structure models. (A) The predicted contact maps of the query, OMPG_ECOLI (P76045). Residue pairs predicted to be in contact are shown in yellow. (B) The predicted contact maps of YAIO_ECOLI (Q47534), the most similar contact map with the GR-align score of 0.733 (C) The predicted contact maps of NANC_ECOL6 (P69856). The second closest contact map with the GR-align score of 0.658. GO terms of these two proteins were used for the prediction. (D) The predicted structure of OMPG_ECOLI (P76045) was generated by trRosetta (rainbow) superimposed with PDB structure 2X9K (gray). The root mean square deviation (RMSD) of the model to the native is 3.63 Å. (E) The predicted structure of YAIO_ECOLI (Q47534) was generated by trRosetta (rainbow). For this protein, no experimental structure has been reported. (F) The predicted structure of NANC_ECOL6 (P69856) was generated by trRosetta (rainbow). No experimental structure was reported for this protein. (G) The top hits for OMPG_ECOLI by PSI-BLAST search against Swiss-Prot. The query itself is shown in the first position. Funsim functional similarity scores (Schlicker et al., 2006; Hawkins et al., 2009). The three categories of each protein compared with the query are shown in the top row in a color scale. The y-axis shows the sequence similarity in the form of -log10 (E-value). The proteins that have incorrect GO terms listed in Table 3 are marked with symbols: *, “metal ion binding” (GO: 0046872); #, “cell adhesion” (GO: 0007155); and †, “cytoplasm” (GO: 0005737).
FIGURE 6
FIGURE 6
Illustration of GO term predictions by ContactPFP for Leucine-rich repeat-containing protein 10 from mouse (LRC10_MOUSE, Q8K3W2). Residue pair contact prediction of (A) The query, LRC10_MOUSE; (B) Leucine-rich repeat-containing protein from bovine, LRC10_BOVIN (Q24K06), and (C) Leucine-rich repeat-containing protein from human LRC10_HUMAN (Q5BKY1). The following three panels, (D–F), are the corresponding predicted structures of these three proteins, respectively. The color shows the orientation of the proteins from the N-terminus to the C-terminus from blue to red. There are no experimentally determined structures for these proteins. (G) The top 50 hits for the query by PSI-BLAST against Swiss-Prot. Funsim scores compared with the query protein are shown in the top row in a color scale. The leftmost column is the query itself. The protein names associated with the “incorrect GO terms” listed in Table 4 are marked with the corresponding symbols, *, “ATP binding” (GO:0005524); #, “defense response” (GO: 0006952); and † “cell junction” (GO:0030054).
FIGURE 7
FIGURE 7
Illustration of GO term predictions by ContactPFP for Cyclin-dependent kinase inhibitor 4 (KRP4_ARATH, Q8GYJ3). The first three panels are predicted contacts for the query, KRP4_ARATH (A), and the two most similar proteins in terms of the contact pattern, (B) TPM3_HUMAN and (C) TPM_CHAFE. The graph similarity scores by GR-align were 0.677 and 0.673, respectively. Panel D, E, F are predicted structures of these three proteins by trRosetta in the same order as the first row. (G), The top 50 hits for the query by PSI-BLAST against Swiss-Prot. Funsim scores compared with the query protein are shown in the top row in a color scale. The most left column is the query itself. The proteins that have incorrect GO terms listed in Table 5 are marked with symbols, *, “actin filament binding” (GO: 0051015); #, “actin filament organization” (GO: 0007015); and †, “microtubule” (GO: 0005874).
FIGURE 8
FIGURE 8
The prediction performance of ensemble methods with ContactPFP. (A) The average Fmax score of ensemble methods with ContactPFP. Results of all the combinations of 1–5 methods are shown. Patterns in the bar graphs show the number of methods combined. The bars are sorted by their Fmax scores. CPFP, ContactPFP; PHYLO, Phylo-PFP; BLAST, PSI-BLAST. (B) Fmax score distribution of the ensemble method with ContactPFP, Phylo-PFP, and PSI-BLAST, the combination with the highest Fmax score, and distributions of individual methods shown in violin plots. The three horizontal bars in a plot indicate the maximum, median, and minimum values. (C) Comparison of Fmax scores of individual target proteins by the best ensemble method and Phylo-PFP. Each point represents a target protein in the benchmark dataset. (D) Comparison of Fmax scores of individual target proteins by the ContactPFP + PhyloPFP and ContactPFP + PSI-BLAST.
FIGURE 9
FIGURE 9
The cumulative computational time of ContactPFP. The time is decomposed into five steps: The database search with HHblits, the distance map prediction by trRosetta, converting a predicted distance map to a contact graph, contact graph comparison against the reference database by GR-Align, constructing GO term list from a hit list, are reported. The times are reported in the wall-clock time (seconds). All computations were performed on CPU, 2 AMD EPYC 7252 cores (16 cores in total) with 128GB RAM. The following 13 proteins were used, which have a length between 100 and 800 amino acids. The length of each protein is shown in the parenthesis. P0CM71 (98), P9WF14 (150), P69162 (200), B1W5S5 (250), A1YG61 (300), Q6Q972 (350), Q550G0 (400), C5A1K9 (450), Q00456 (500), A1DHW5 (550), A5DX93 (600), Q96QV1 (700), and Q54WZ0 (800). These proteins were chosen because they hit the same number of sequences, 500 (± 10) sequences, by HHblits.

Similar articles

Cited by

References

    1. Abriata L. A., Tamò G. E., Dal Peraro M. (2019). A Further Leap of Improvement in Tertiary Structure Prediction in CASP13 Prompts New Routes for Future Assessments. Proteins 87, 1100–1112. 10.1002/prot.25787 - DOI - PubMed
    1. Aderinwale T., Bharadwaj V., Christoffer C., Terashi G., Zhang Z., Jahandideh R., et al. (2022). Real-Time Structure Search and Structure Classification for AlphaFold Protein Models. Commun. Biol. 5 (1), 316. 10.1038/s42003-022-03261-8 - DOI - PMC - PubMed
    1. Altschul S. F., Gish W., Miller W., Myers E. W., Lipman D. J. (1990). Basic Local Alignment Search Tool. J. Mol. Biol. 215, 403–410. 10.1016/S0022-2836(05)80360-2 - DOI - PubMed
    1. Altschul S. F., Madden T. L., Schäffer A. A., Zhang J., Zhang Z., Miller W., et al. (1997). Gapped BLAST and PSI-BLAST: A New Generation of Protein Database Search Programs. Nucleic Acids Res. 25, 3389–3402. 10.1093/nar/25.17.3389 - DOI - PMC - PubMed
    1. Attwood T. K., Coletta A., Muirhead G., Pavlopoulou A., Philippou P. B., Popov I., et al. (2012). The PRINTS Database: A Fine-Grained Protein Sequence Annotation and Analysis Resource—Its Status in 2012. Database 2012, bas019. 10.1093/database/bas019 - DOI - PMC - PubMed

LinkOut - more resources