

Temporal Changes in Fecal Unabsorbed Carbohydrates Relative to Perturbations in Gut Microbiome of Neonatal Calves: Emerging of Diarrhea Induced by Extended-Spectrum β-lactamase-Producing Enteroaggregative Escherichia coli
- PMID: 35875583
- PMCID: PMC9301005
- DOI: 10.3389/fmicb.2022.883090
Temporal Changes in Fecal Unabsorbed Carbohydrates Relative to Perturbations in Gut Microbiome of Neonatal Calves: Emerging of Diarrhea Induced by Extended-Spectrum β-lactamase-Producing Enteroaggregative Escherichia coli
Abstract
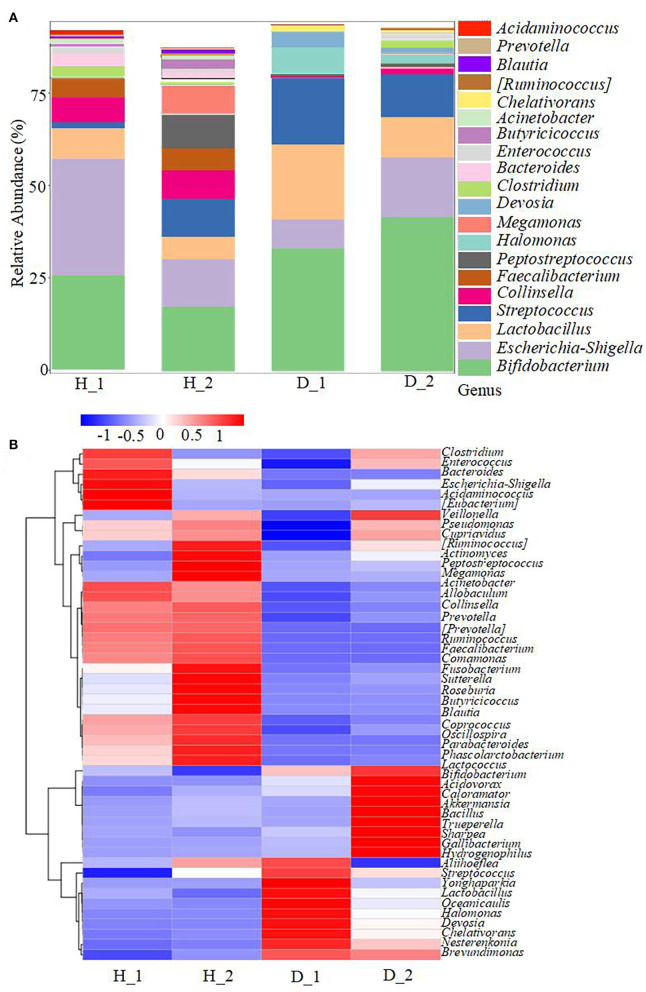
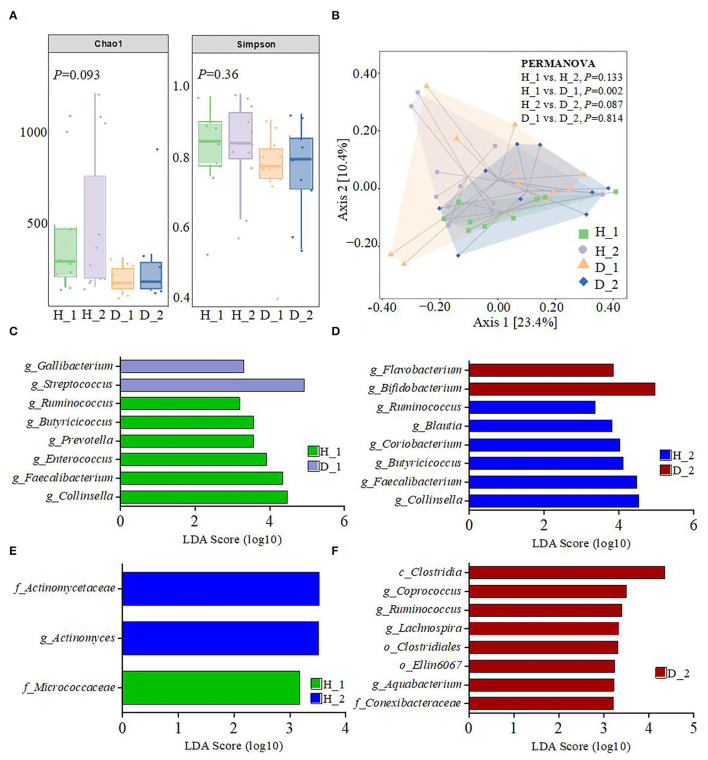
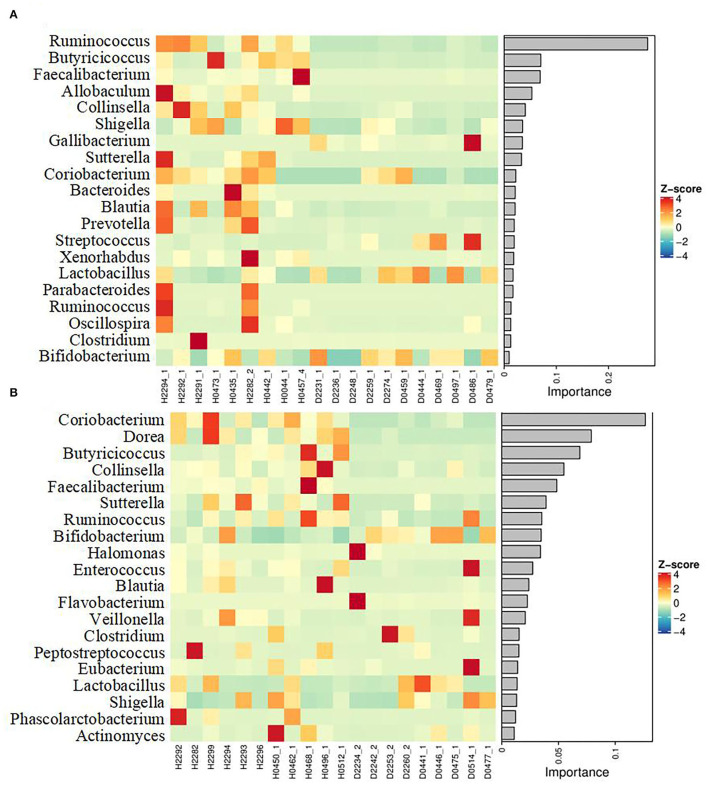
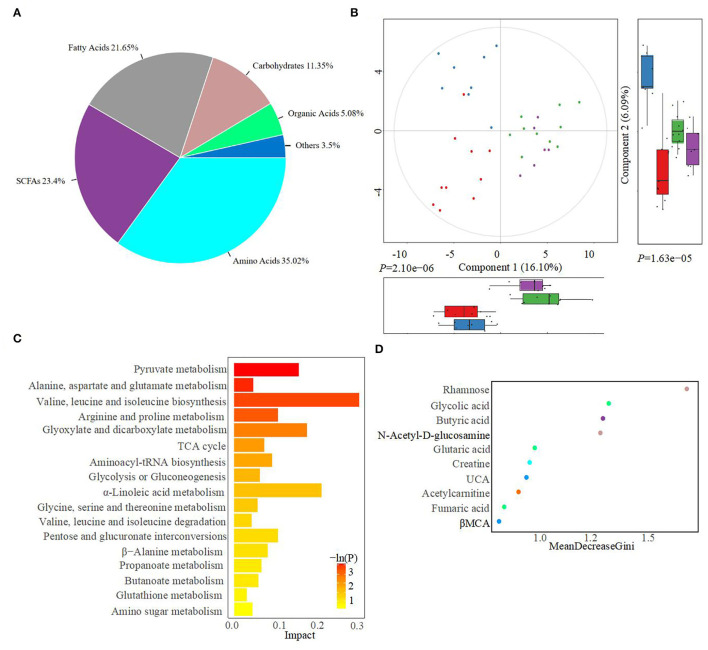
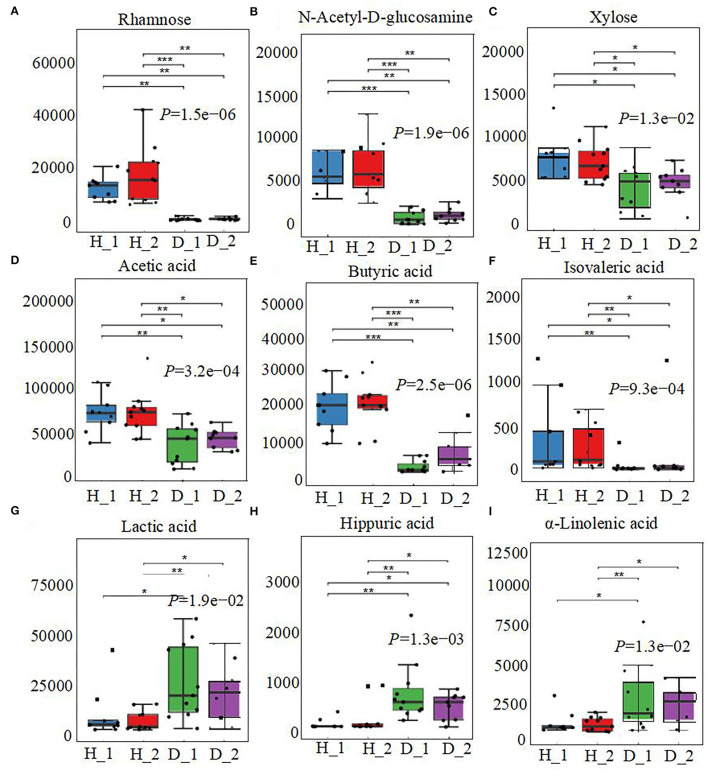
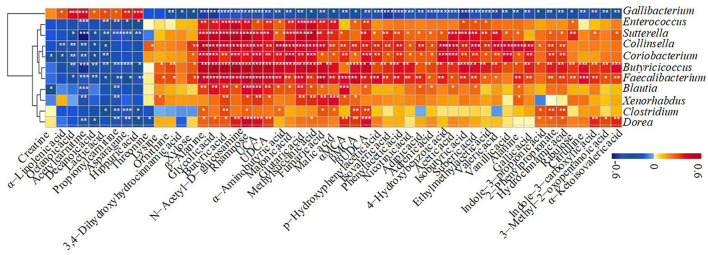
Early gut microbiota development and colonization are crucial for the long-term health and performance of ruminants. However, cognition among these microbiota is still vague, particularly among the neonatal dairy calves. Here, extended-spectrum β-lactamase-producing enteroaggregative E. coli (ESBL-EAEC)-induced temporal changes in diversity, stability, and composition of gut microbiota were investigated among the neonatal female calves, with the view of discerning potential biomarkers of this arising diarrhea cases in local pastures. Nearly, 116 newborn calves were enrolled in this time period study during their first 2 weeks of life, and a total of 40 selected fecal samples from corresponding calves were used in this study. The results revealed that differentiated gut microbiome and metabolome discerned from neonatal calves were accompanied by bacterial infections over time. Commensal organisms like Butyricicoccus, Faecalibacterium, Ruminococcus, Collinsella, and Coriobacterium, as key microbial markers, mainly distinguish "healthy" and "diarrheic" gut microbiome. Random forest machine learning algorithm indicated that enriched fecal carbohydrates, including rhamnose and N-acetyl-D-glucosamine, and abundant short-chain fatty acids (SCFAs) existed in healthy ones. In addition, Spearman correlation results suggested that the presence of Butyricicoccus, Faecalibacterium, Collinsella, and Coriobacterium, key commensal bacteria of healthy calves, is positively related to high production of unabsorbed carbohydrates, SCFAs, and other prebiotics, and negatively correlated to increased concentrations of lactic acid, hippuric acid, and α-linolenic acid. Our data suggested that ESBL-EAEC-induced diarrhea in female calves could be forecasted by alterations in the gut microbiome and markedly changed unabsorbed carbohydrates in feces during early lives, which might be conducive to conduct early interventions to ameliorate clinical symptoms of diarrhea induced by the rising prevalence of ESBL-EAEC.
Keywords: enteroaggregative E. coli; extended-spectrum β-lactamase producing E. coli; gut microbiome; metabolome; neonatal dairy calves; unabsorbed carbohydrates.
Copyright © 2022 He, Ma, Chen, Yang, Zhang, Liu, Xiao, Wang, Wang, Yang, Li and Cao.
Conflict of interest statement
The authors declare that the research was conducted in the absence of any commercial or financial relationships that could be construed as a potential conflict of interest.
Figures
Similar articles
-
Gut microbiota-derived ursodeoxycholic acid from neonatal dairy calves improves intestinal homeostasis and colitis to attenuate extended-spectrum β-lactamase-producing enteroaggregative Escherichia coli infection.Microbiome. 2022 May 28;10(1):79. doi: 10.1186/s40168-022-01269-0. Microbiome. 2022. PMID: 35643532 Free PMC article.
-
Protective Effects of Intestinal Gallic Acid in Neonatal Dairy Calves Against Extended-Spectrum β-lactamase Producing Enteroaggregative Escherichia coli Infection: Modulating Intestinal Homeostasis and Colitis.Front Nutr. 2022 Mar 24;9:864080. doi: 10.3389/fnut.2022.864080. eCollection 2022. Front Nutr. 2022. PMID: 35399688 Free PMC article.
-
Characterization of fecal branched-chain fatty acid profiles and their associations with fecal microbiota in diarrheic and healthy dairy calves.J Dairy Sci. 2021 Feb;104(2):2290-2301. doi: 10.3168/jds.2020-18825. Epub 2020 Dec 23. J Dairy Sci. 2021. PMID: 33358167
-
Extended-spectrum beta-lactamase-producing strains among diarrhoeagenic Escherichia coli-prospective traveller study with literature review.J Travel Med. 2022 Jan 17;29(1):taab042. doi: 10.1093/jtm/taab042. J Travel Med. 2022. PMID: 33834207 Free PMC article. Review.
-
Colonization and development of the gut microbiome in calves.J Anim Sci Biotechnol. 2023 Apr 9;14(1):46. doi: 10.1186/s40104-023-00856-x. J Anim Sci Biotechnol. 2023. PMID: 37031166 Free PMC article. Review.
Cited by
-
Fecal Microbial Communities of Nellore and Crossbred Beef Calves Raised at Pasture.Animals (Basel). 2024 May 13;14(10):1447. doi: 10.3390/ani14101447. Animals (Basel). 2024. PMID: 38791664 Free PMC article.
-
The roles of short-chain fatty acids derived from colonic bacteria fermentation of non-digestible carbohydrates and exogenous forms in ameliorating intestinal mucosal immunity of young ruminants.Front Immunol. 2023 Dec 11;14:1291846. doi: 10.3389/fimmu.2023.1291846. eCollection 2023. Front Immunol. 2023. PMID: 38149240 Free PMC article. Review.
-
Effects of different combinations of antibacterial compound supplements in calf pellets on growth performance, health, blood parameters, and rumen microbiome of dairy calves.Front Vet Sci. 2024 May 13;11:1376758. doi: 10.3389/fvets.2024.1376758. eCollection 2024. Front Vet Sci. 2024. PMID: 38803795 Free PMC article.
-
Fecal metabolomics to understand intestinal dysfunction in male dairy beef calves at arrival to the rearing farm.Sci Rep. 2025 Feb 26;15(1):6887. doi: 10.1038/s41598-025-90407-3. Sci Rep. 2025. PMID: 40011507 Free PMC article.
-
Changes in the gut microbiome due to diarrhea in neonatal Korean indigenous calves.Front Microbiol. 2025 Mar 5;16:1511430. doi: 10.3389/fmicb.2025.1511430. eCollection 2025. Front Microbiol. 2025. PMID: 40109976 Free PMC article.
References
LinkOut - more resources
Full Text Sources