

Activin A Secreted From Peripheral Nerve Fibroblasts Promotes Proliferation and Migration of Schwann Cells
- PMID: 35875658
- PMCID: PMC9301483
- DOI: 10.3389/fnmol.2022.859349
Activin A Secreted From Peripheral Nerve Fibroblasts Promotes Proliferation and Migration of Schwann Cells
Abstract
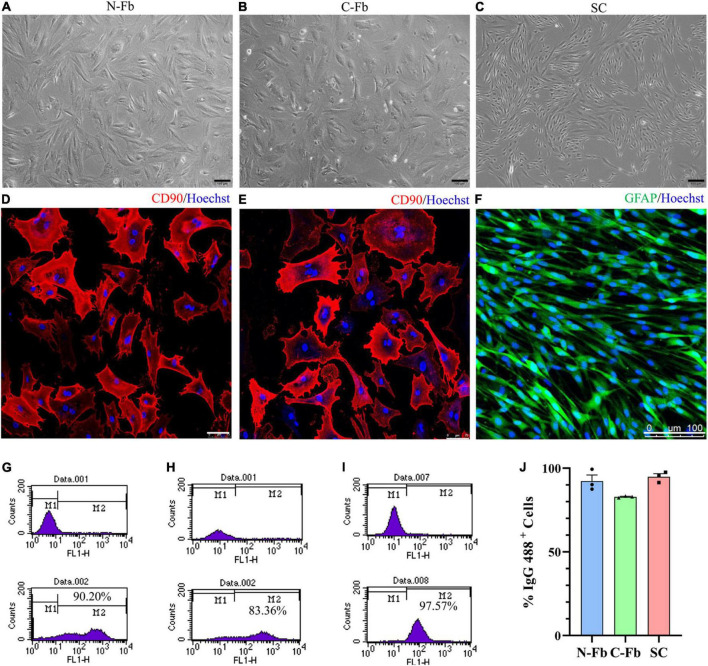
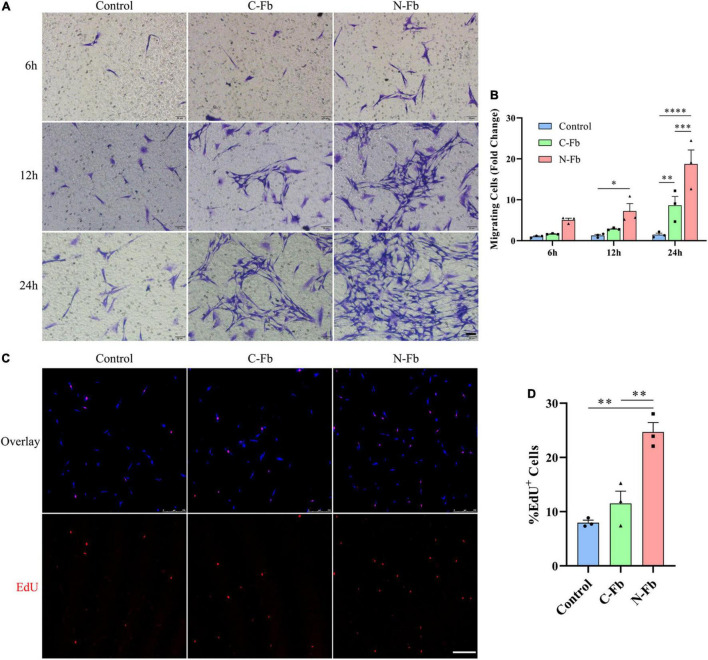
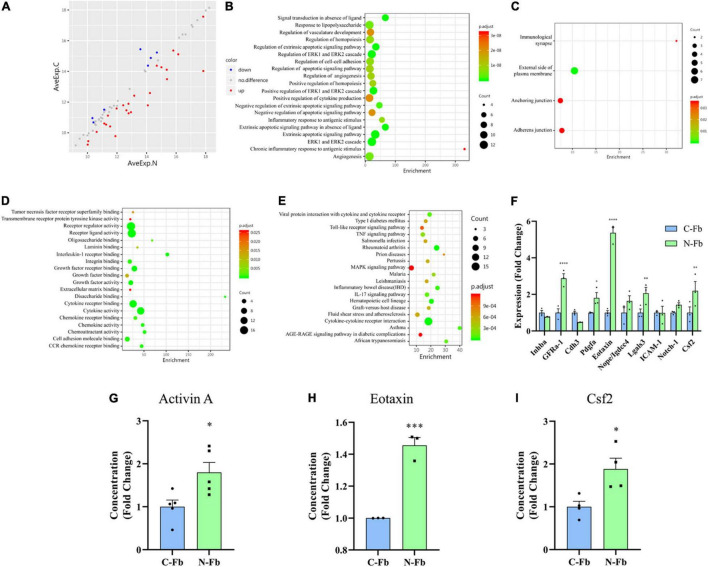
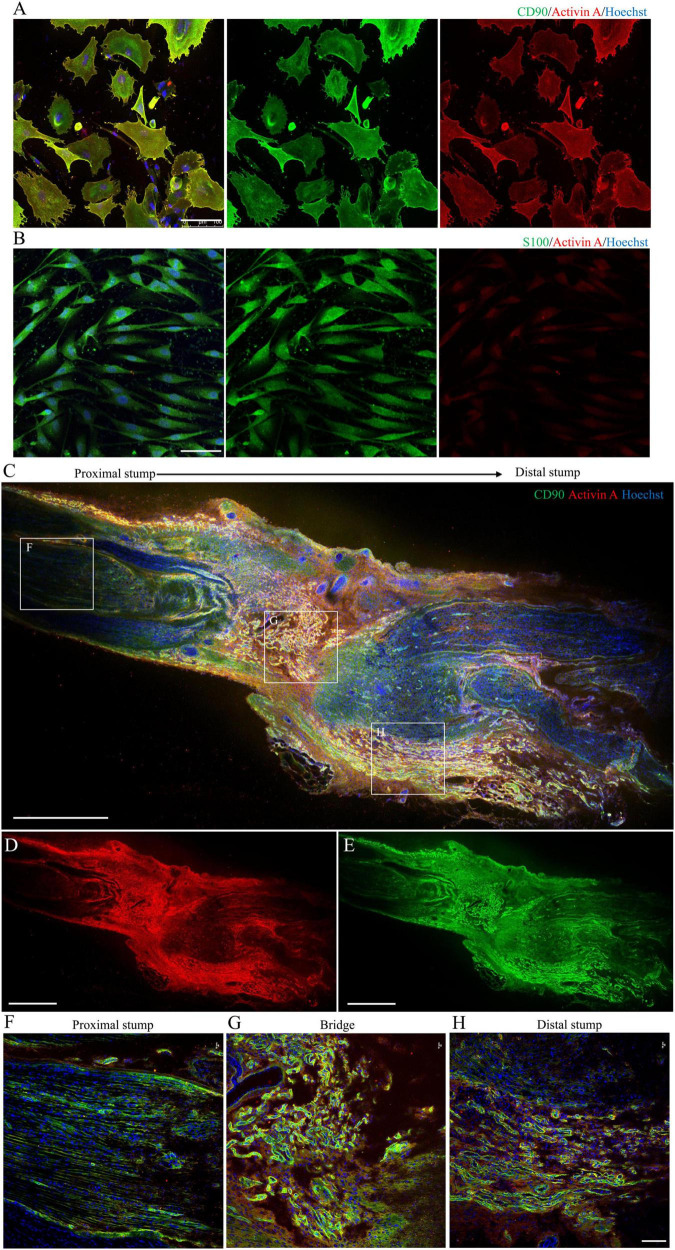
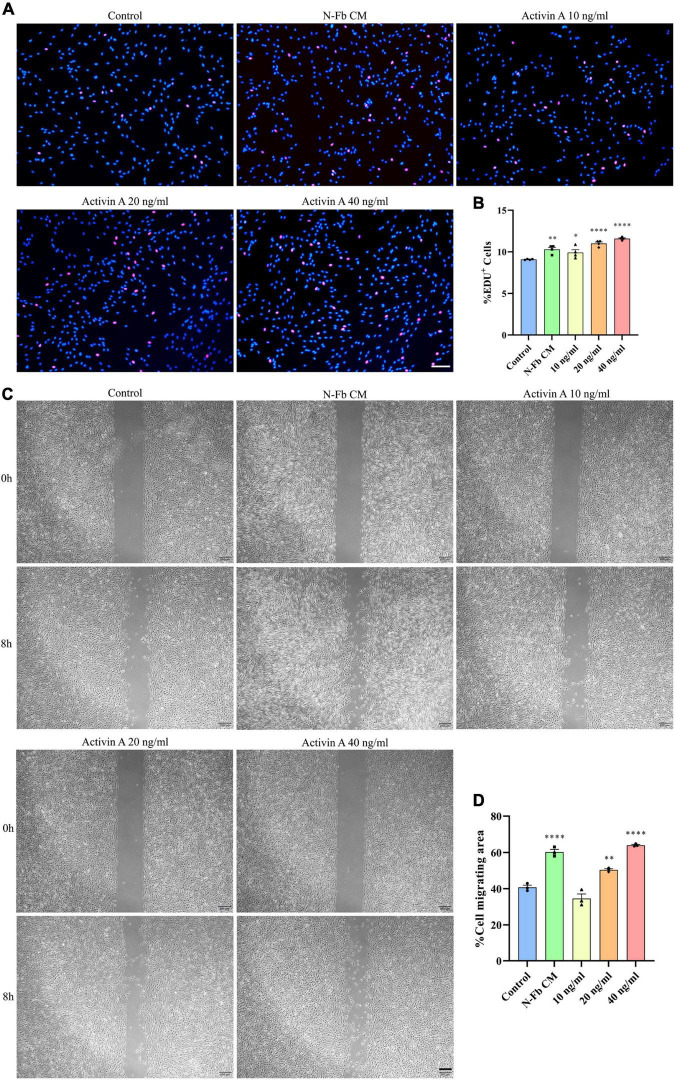
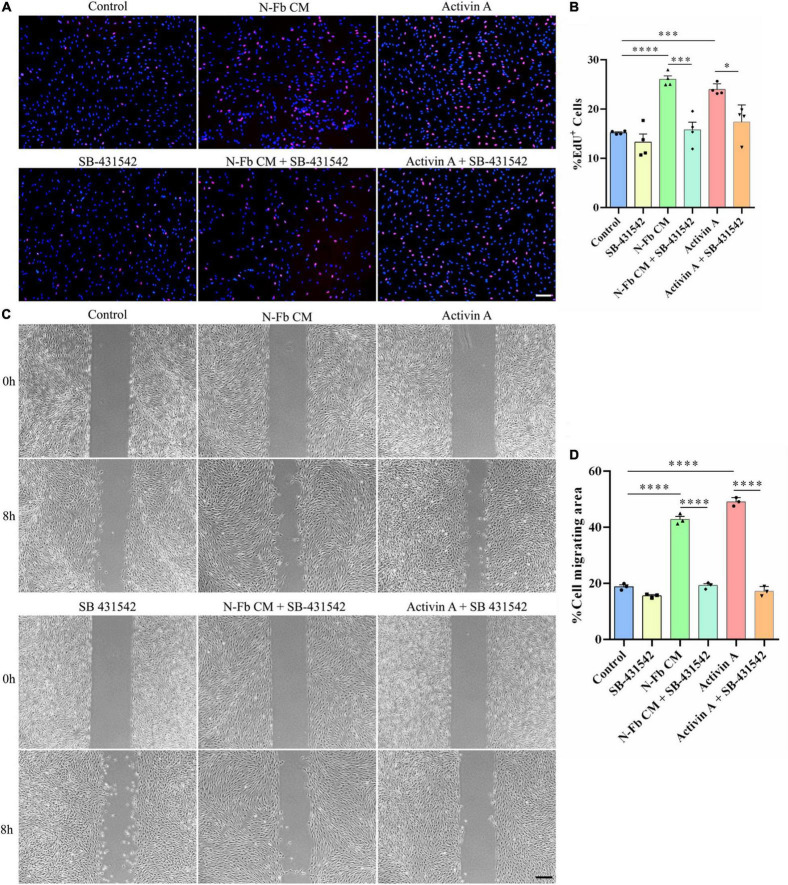
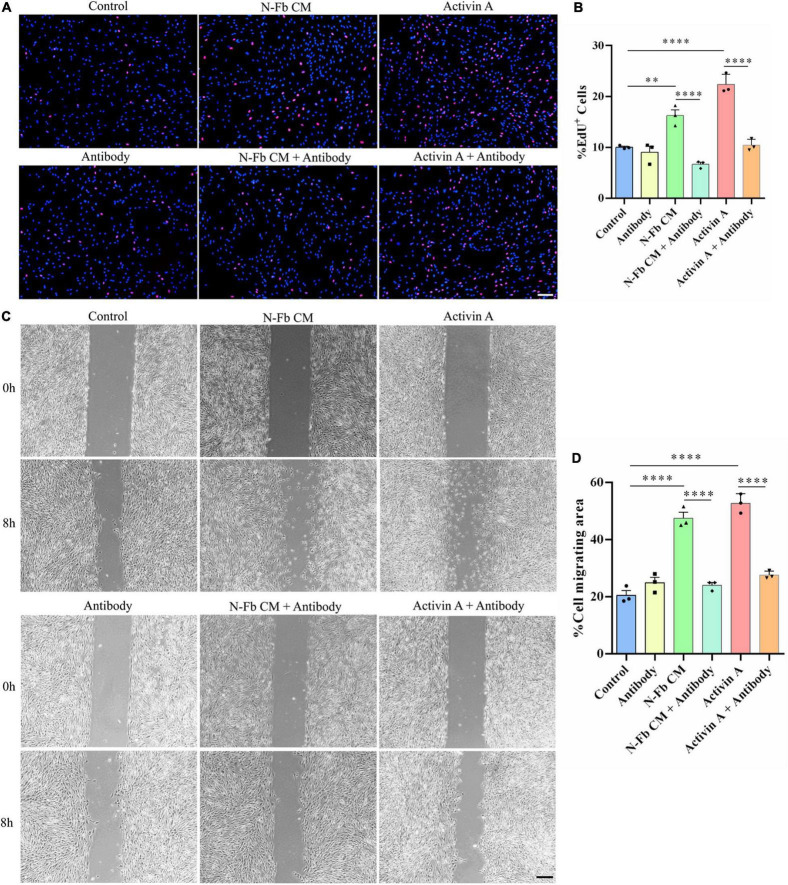
The peripheral nervous system has remarkable regenerative capabilities. Schwann cells and fibroblasts are known to play crucial roles in these processes. In this study, we delineated the differential effects of peripheral nerve fibroblasts and cardiac fibroblasts on Schwann cells. We found that peripheral nerve fibroblasts significantly promoted Schwann cell proliferation and migration compared with cardiac fibroblasts. The cytokine array results identified 32 of 67 proteins that were considered differentially expressed in peripheral nerve fibroblasts versus cardiac fibroblasts. Among them, 25 were significantly upregulated in peripheral nerve fibroblasts compared with cardiac fibroblasts. Activin A, the protein with the greatest differential expression, clearly co-localized with fibroblasts in the in vivo sciatic never injury rat model. In vitro experiments proved that activin A secreted from nerve fibroblasts is the key factor responsible for boosting proliferation and migration of Schwann cells through ALK4, ALK5, and ALK7. Overall, these findings suggest that peripheral nerve fibroblasts and cardiac fibroblasts exhibit different patterns of cytokine secretion and activin A secreted from peripheral nerve fibroblasts can promote the proliferation and migration of Schwann cells.
Keywords: Schwann cells; activin A; cytokine array; fibroblasts; migration; peripheral nervous system; proliferation.
Copyright © 2022 Li, Cheng, Yu, Zhang, Yu, Ding and He.
Conflict of interest statement
The authors declare that the research was conducted in the absence of any commercial or financial relationships that could be construed as a potential conflict of interest.
Figures
Similar articles
-
Molecular and cellular mechanisms underlying peripheral nerve injury-induced cellular ecological shifts: Implications for neuroregeneration.IBRO Neurosci Rep. 2024 Dec 28;18:120-129. doi: 10.1016/j.ibneur.2024.12.013. eCollection 2025 Jun. IBRO Neurosci Rep. 2024. PMID: 39877591 Free PMC article. Review.
-
Peripheral nerve fibroblasts secrete neurotrophic factors to promote axon growth of motoneurons.Neural Regen Res. 2022 Aug;17(8):1833-1840. doi: 10.4103/1673-5374.332159. Neural Regen Res. 2022. PMID: 35017446 Free PMC article.
-
Fibroblast-derived tenascin-C promotes Schwann cell migration through β1-integrin dependent pathway during peripheral nerve regeneration.Glia. 2016 Mar;64(3):374-85. doi: 10.1002/glia.22934. Epub 2015 Oct 24. Glia. 2016. PMID: 26497118
-
Increased levels of miR-3099 induced by peripheral nerve injury promote Schwann cell proliferation and migration.Neural Regen Res. 2019 Mar;14(3):525-531. doi: 10.4103/1673-5374.245478. Neural Regen Res. 2019. PMID: 30539823 Free PMC article.
-
Migrating Schwann cells direct axon regeneration within the peripheral nerve bridge.Glia. 2021 Feb;69(2):235-254. doi: 10.1002/glia.23892. Epub 2020 Jul 22. Glia. 2021. PMID: 32697392 Review.
Cited by
-
Electroacupuncture Promotes Nerve Regeneration and Functional Recovery Through Regulating lncRNA GAS5 Targeting miR-21 After Sciatic Nerve Injury.Mol Neurobiol. 2024 Feb;61(2):935-949. doi: 10.1007/s12035-023-03613-3. Epub 2023 Sep 6. Mol Neurobiol. 2024. PMID: 37672149 Free PMC article.
-
Molecular and cellular mechanisms underlying peripheral nerve injury-induced cellular ecological shifts: Implications for neuroregeneration.IBRO Neurosci Rep. 2024 Dec 28;18:120-129. doi: 10.1016/j.ibneur.2024.12.013. eCollection 2025 Jun. IBRO Neurosci Rep. 2024. PMID: 39877591 Free PMC article. Review.
-
Non-coding RNAs involved in the molecular pathology of Alzheimer's disease: a systematic review.Front Neurosci. 2024 Jun 28;18:1421675. doi: 10.3389/fnins.2024.1421675. eCollection 2024. Front Neurosci. 2024. PMID: 39005845 Free PMC article.
-
Unleashing Axonal Regeneration Capacities: Neuronal and Non-neuronal Changes After Injuries to Dorsal Root Ganglion Neuron Central and Peripheral Axonal Branches.Mol Neurobiol. 2024 Jan;61(1):423-433. doi: 10.1007/s12035-023-03590-7. Epub 2023 Aug 24. Mol Neurobiol. 2024. PMID: 37620687 Review.
-
Fibronectin mediates activin A-promoted human trophoblast migration and acquisition of endothelial-like phenotype.Cell Commun Signal. 2024 Jan 23;22(1):61. doi: 10.1186/s12964-023-01463-z. Cell Commun Signal. 2024. PMID: 38263146 Free PMC article.
References
-
- De Berdt P., Bottemanne P., Bianco J., Alhouayek M., Diogenes A., Lloyd A., et al. (2018). Stem cells from human apical papilla decrease neuro-inflammation and stimulate oligodendrocyte progenitor differentiation via activin-A secretion. Cell. Mol. Life Sci. 75 2843–2856. 10.1007/s00018-018-2764-5 - DOI - PMC - PubMed
LinkOut - more resources
Full Text Sources