. 2022 Jul 7:15:926596.
doi: 10.3389/fnmol.2022.926596. eCollection 2022.

Anatomical Analysis of Transient Potential Vanilloid Receptor 1 (Trpv1+) and Mu-Opioid Receptor (Oprm1+) Co-expression in Rat Dorsal Root Ganglion Neurons

Affiliations

Anatomical Analysis of Transient Potential Vanilloid Receptor 1 (Trpv1+) and Mu-Opioid Receptor (Oprm1+) Co-expression in Rat Dorsal Root Ganglion Neurons

Wenting Ma et al. Front Mol Neurosci. .

Abstract

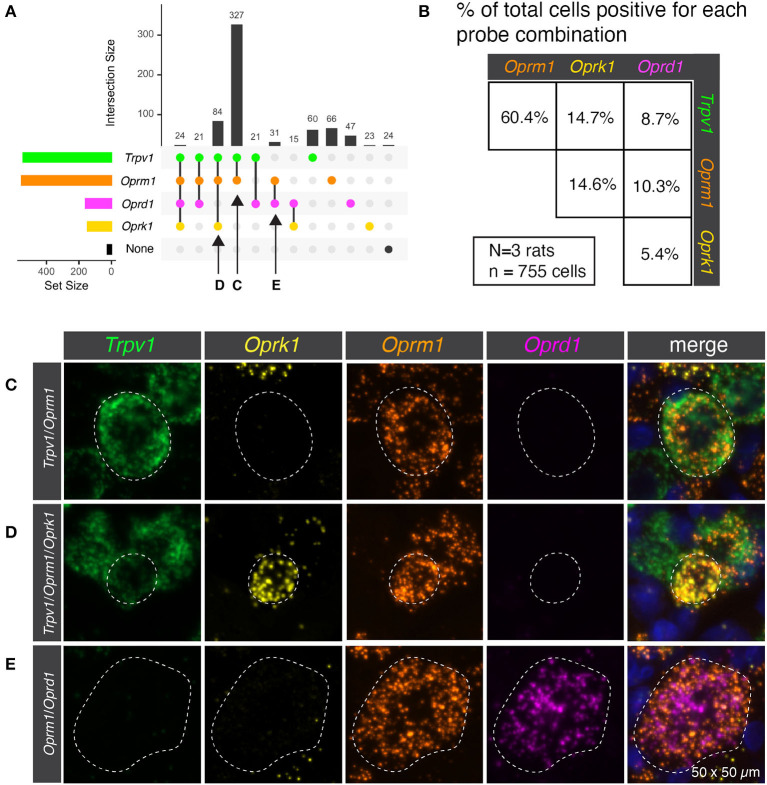
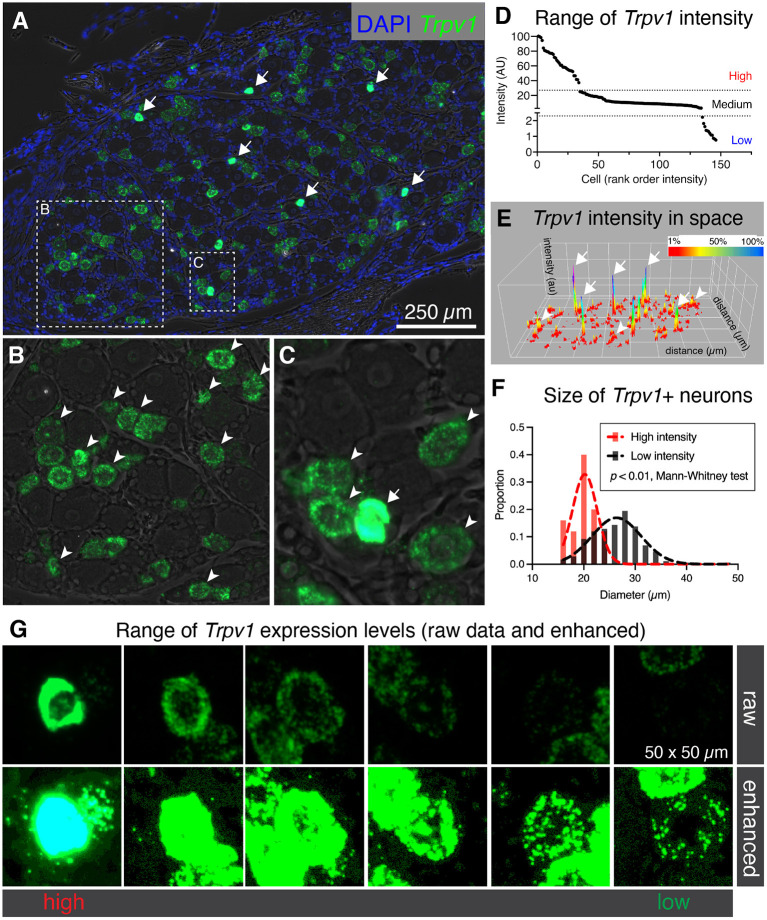
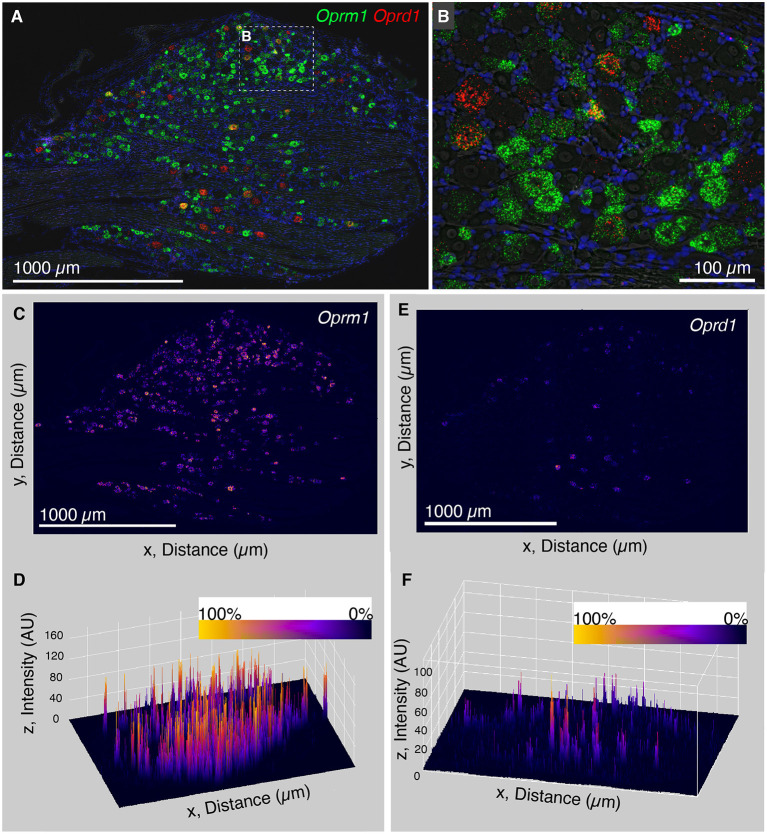
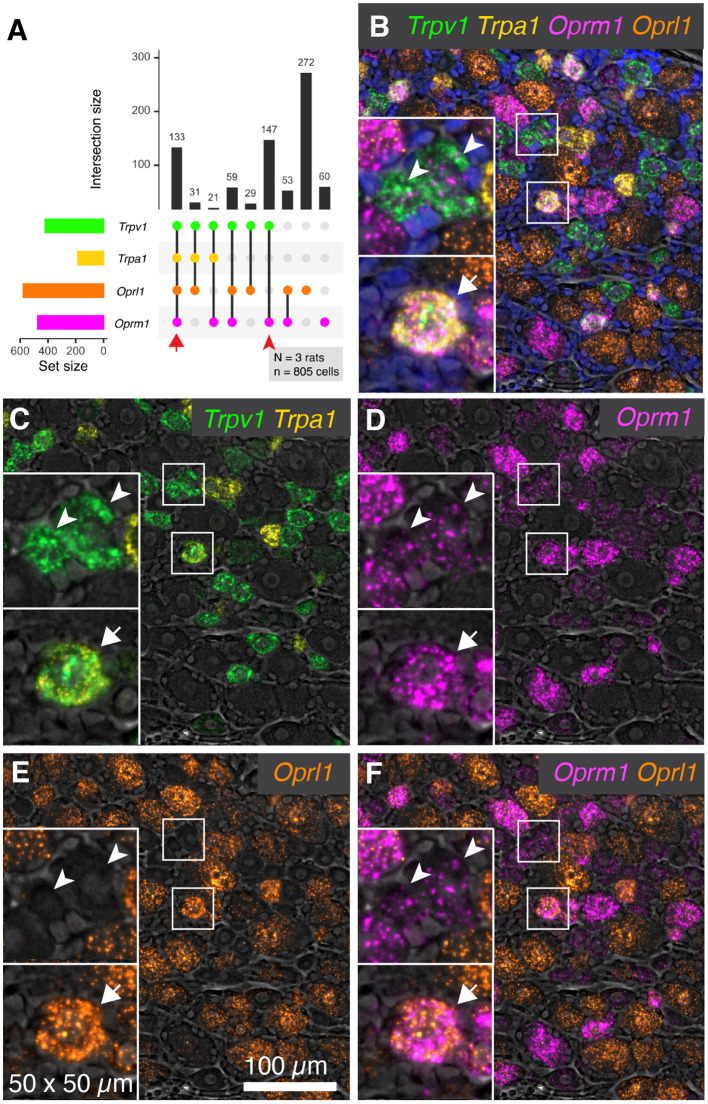
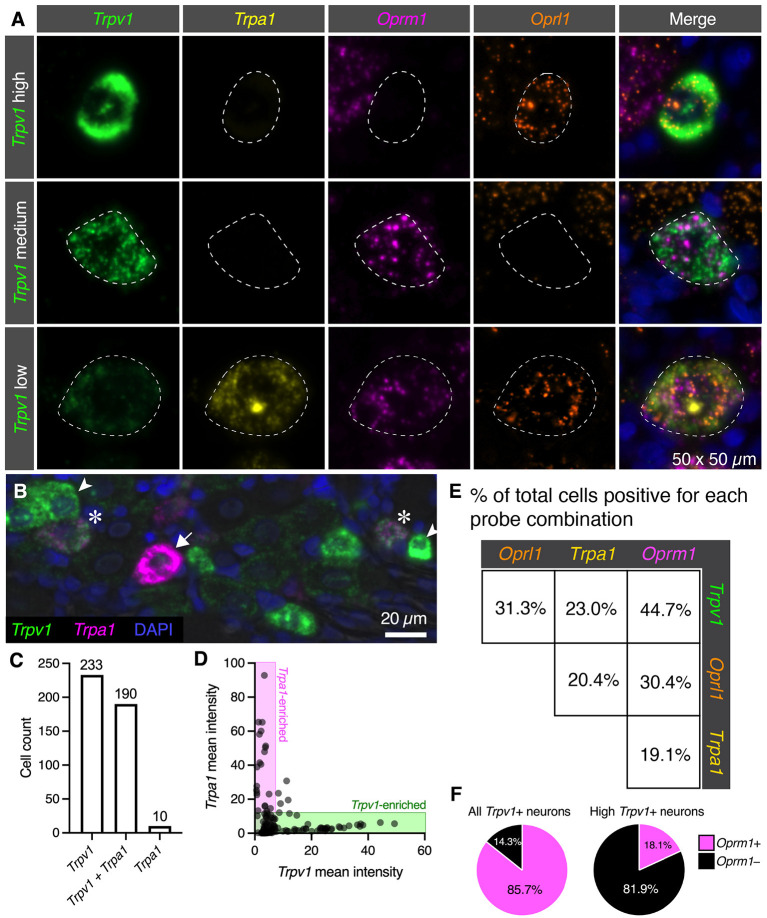
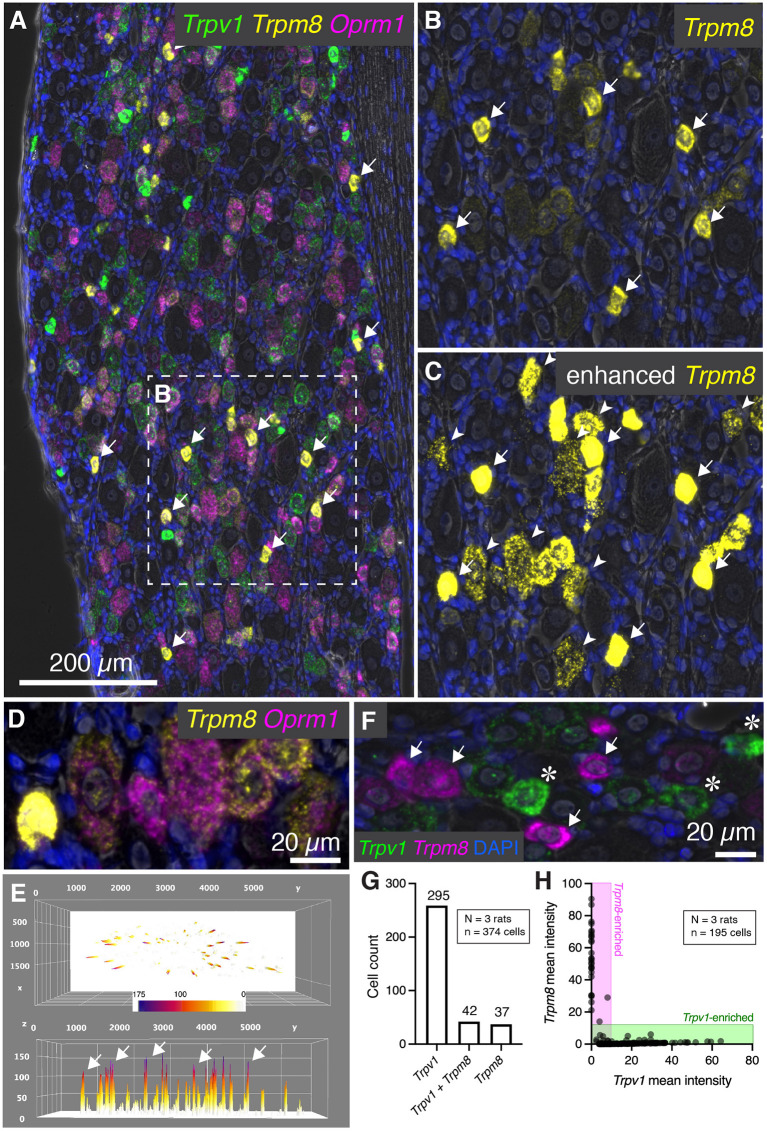
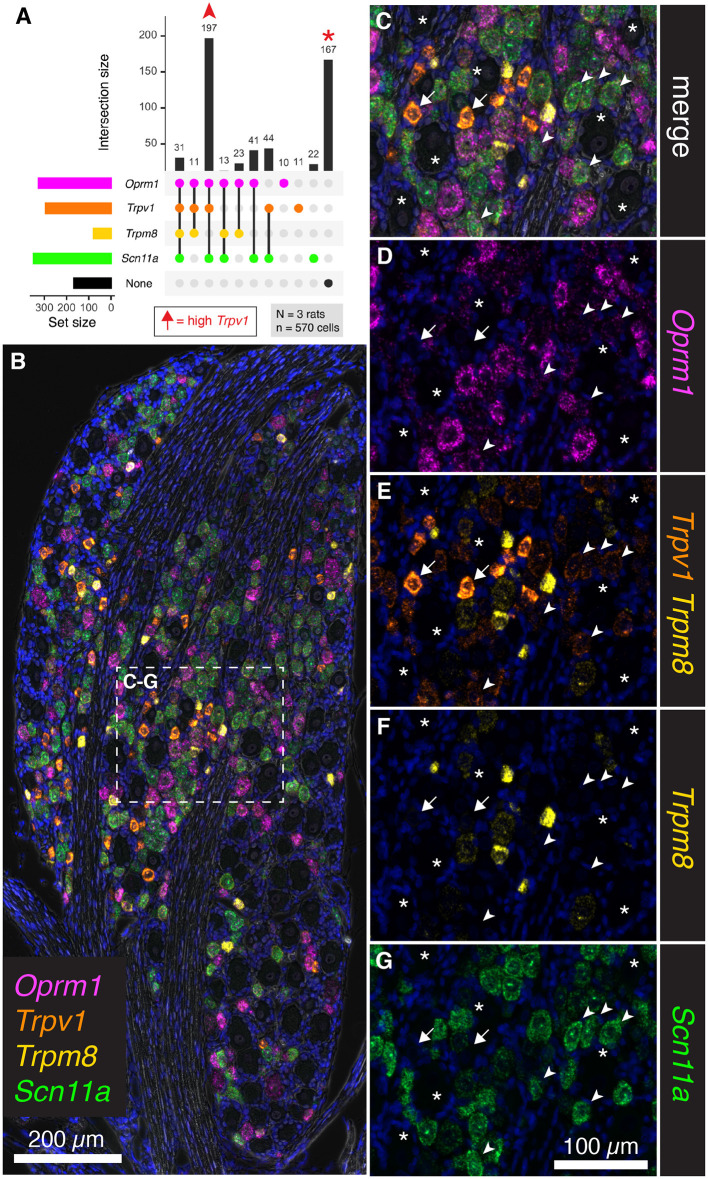
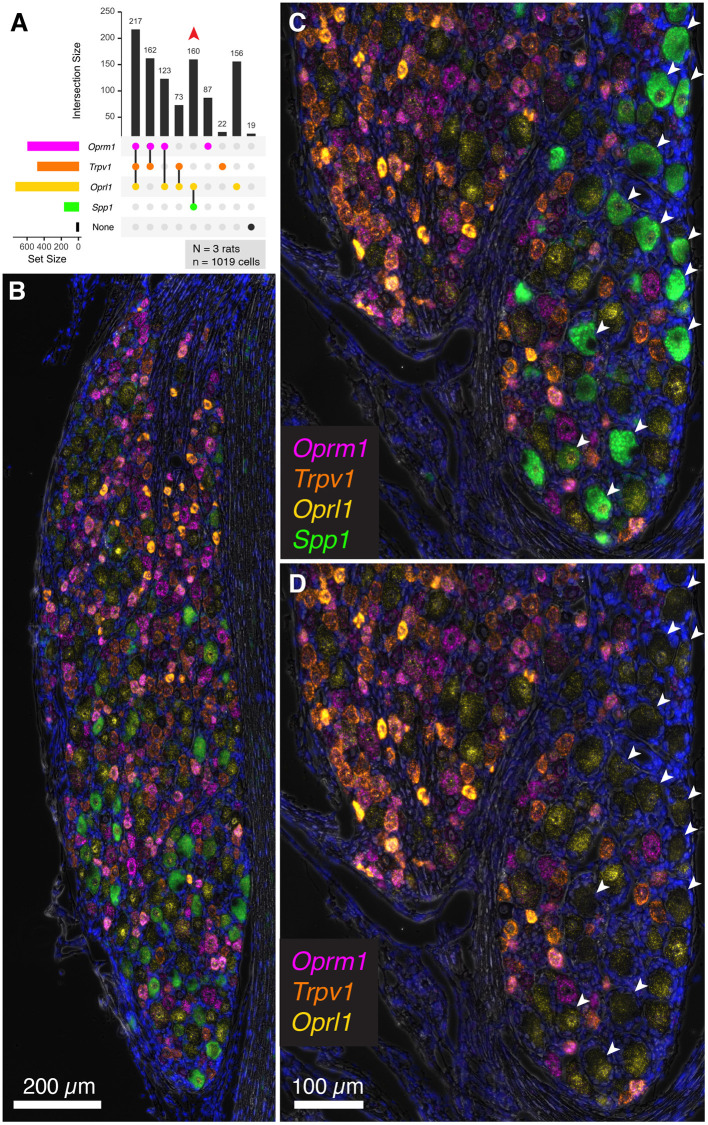
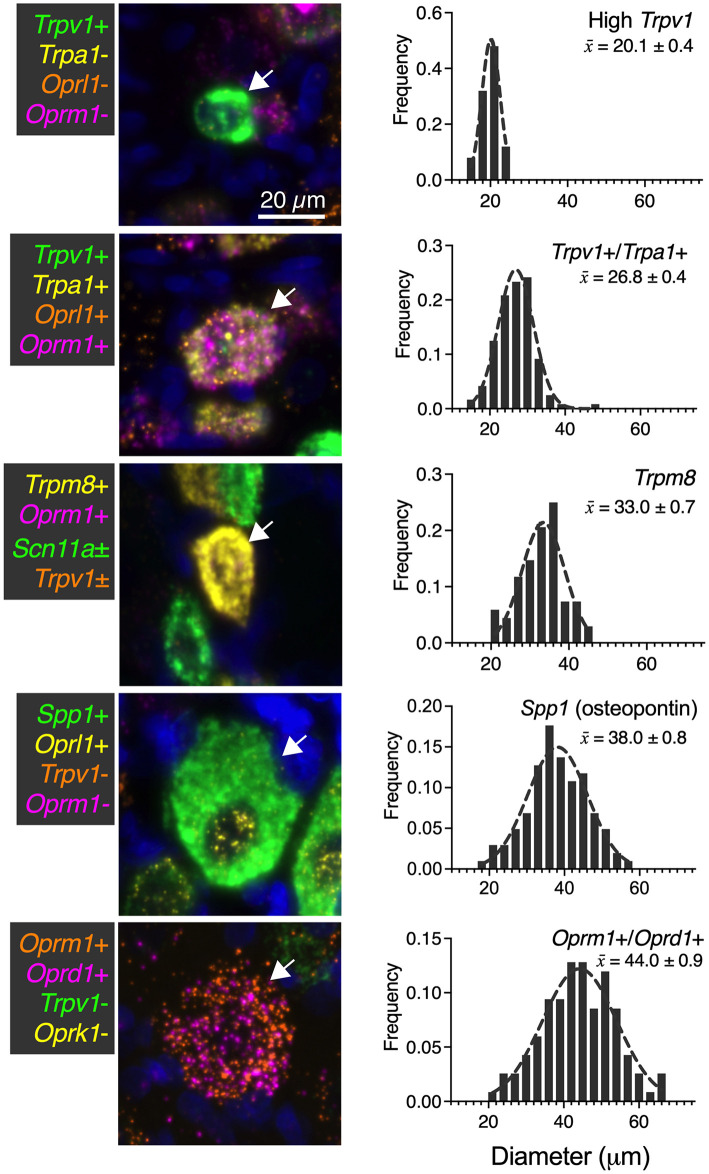
Primary afferent neurons of the dorsal root ganglia (DRG) transduce peripheral nociceptive signals and transmit them to the spinal cord. These neurons also mediate analgesic control of the nociceptive inputs, particularly through the μ-opioid receptor (encoded by Oprm1). While opioid receptors are found throughout the neuraxis and in the spinal cord tissue itself, intrathecal administration of μ-opioid agonists also acts directly on nociceptive nerve terminals in the dorsal spinal cord resulting in marked analgesia. Additionally, selective chemoaxotomy of cells expressing the TRPV1 channel, a nonselective calcium-permeable ion channel that transduces thermal and inflammatory pain, yields profound pain relief in rats, canines, and humans. However, the relationship between Oprm1 and Trpv1 expressing DRG neurons has not been precisely determined. The present study examines rat DRG neurons using high resolution multiplex fluorescent in situ hybridization to visualize molecular co-expression. Neurons positive for Trpv1 exhibited varying levels of expression for Trpv1 and co-expression of other excitatory and inhibitory ion channels or receptors. A subpopulation of densely labeled Trpv1+ neurons did not co-express Oprm1. In contrast, a population of less densely labeled Trpv1+ neurons did co-express Oprm1. This finding suggests that the medium/low Trpv1 expressing neurons represent a specific set of DRG neurons subserving the opponent processes of both transducing and inhibiting nociceptive inputs. Additionally, the medium/low Trpv1 expressing neurons co-expressed other markers implicated in pathological pain states, such as Trpa1 and Trpm8, which are involved in chemical nociception and cold allodynia, respectively, as well as Scn11a, whose mutations are implicated in familial episodic pain. Conversely, none of the Trpv1+ neurons co-expressed Spp1, which codes for osteopontin, a marker for large diameter proprioceptive neurons, validating that nociception and proprioception are governed by separate neuronal populations. Our findings support the hypothesis that the population of Trpv1 and Oprm1 coexpressing neurons may explain the remarkable efficacy of opioid drugs administered at the level of the DRG-spinal synapse, and that this subpopulation of Trpv1+ neurons is responsible for registering tissue damage.

Keywords: Kappa opioid receptor (KOR); TRPM8; dorsal root ganglia (DRG); mu opioid (MOP) receptor; nociception; opioid receptor; transient receptor potential A1 (TRPA1); transient receptor potential vanilloid-1 (TRPV1).


Conflict of interest statement

The authors declare that the research was conducted in the absence of any commercial or financial relationships that could be construed as a potential conflict of interest.

Figures

Figure 1
Figure 1
Co-expression of transient receptor potential vanilloid 1 (Trpv1) and the three opioid receptors (Oprm1, Oprk1, Oprd1). (A) Semiquantitative analysis was performed to count the number of cells present or absent for each of the four marker genes. This analysis subdivided the sensory afferents into 12 populations, although not all of these populations were prevalent. (B) In order to simplify the overlap between Trpv1 and Opioid receptor transcripts, a pairwise matrix of percentages is shown. This shows the total number of neurons positive for each marker (set size) as well as the number of cells positive for combinations of markers (intersection size; see Methods section). This display clarifies that Trpv1+/Oprm1+ cells were very prevalent in the DRG, comprising 60.4% of all neurons (ignoring categorization by the other markers.). While all possible combinations were identified, some were quite rare, with the population of cells positive for both Oprk1 and Oprd1 (the rarest combination) comprising ~5% of neurons. (C) Representative multi-channel microscopy images are shown for three of the populations identified in panel A, the first of which being Trpv1+/Oprm1+ neurons. These neurons were the most abundant population at 327 of 755 total cells (or 43.3%). (D) The Trpv1+/Oprm1+/Oprk1+ population is shown, which is the second most abundant subpopulation at 84/755 cells (11.1%). (E) Finally, a representative cell from the Oprm1+/Oprd1+ population is shown. This population is rare, but is large and expresses very high levels of both Oprm1 and Oprd1. Outlines of neurons are shown to enhance visibility (dotted lines).
Figure 2
Figure 2
Heterogeneous labeling of Trpv1 mRNA in rat dorsal root ganglion (DRG). (A) Fluorescent in situ hybridization was performed and imaged for whole rat DRG sections (N = 3). Very high levels of expression were observed in a small number of small diameter neurons (white arrows). (B) An enlargement of a neuron-rich region is shown with Trpv1+ neurons (arrowheads). (C) A second enlargement includes one high-expressing Trpv1+ neuron (arrow) and several other Trpv1+ neurons with moderate staining intensity (arrowheads). (D) Intensity values for Trpv1 were plotted by rank order. Based on these values, Trpv1 expression was divided into high, medium and low expression. (E) A surface plot was generated for Trpv1 intensity (arbitrary units, Z-axis) across the entire DRG section shown in (A). This plot shows the relationship between the high-expressing Trpv1 DRG neurons and other cells in the ganglion. Note the high peaks indicating a quantitatively separate population (white arrows). (F) Diameter of the high intensity Trpv1+ neurons was examined by measuring the area in Fiji. High intensity Trpv1+ neurons had a stereotyped small diameter as represented by the narrow Gaussian (red) relative to the broader distribution of medium/low Trpv1+ neurons (black Gaussian). This difference was significant based on a Mann-Whitney test (p < 0.01). (G) Representative fields of 6 Trpv1+ DRG neurons are shown, spanning a range of expression levels. Scanning parameters are tuned so as not to saturate the brightest cells. Note that the range of expression values is such that when the lower expressing Trpv1+ neurons are visible, the highest cells are saturated.
Figure 3
Figure 3
Analysis of intensity distribution for the opioid receptor genes Oprm1 and Oprd1. The finding that Trpv1 was unevenly distributed in rat DRG prompted an investigation of Oprm1 and Oprd1 to answer whether these analgesic opioid receptors were also distributed unevenly across cell populations. (A) In a wide field view of a DRG stained for Oprm1 and Oprd1, we did not observe marked differences in expression across the field. The gene encoding the mu-opioid receptor (Oprm1) is much more widely expressed than the delta receptor gene (Opd1), and both show a range of expression values. (B) However, this range appeared qualitative smaller than that observed for Trpv1. (C) In order to quantify this further, we used a surface plot to represent intensity over area for Oprm1. (D) When viewed from an angle, this analysis shows many peaks of similar height across the DRG, consistent with the wide expression pattern of Oprm1. This is in contrast to Trpv1, which showed several very high peaks (Figure 2E). (E) The same analysis was also performed for Oprd1, which is expressed in many fewer cells than either Trpv1 or Oprm1. (F) Viewed at an angle, most of these Oprd1 peaks are evident in the same linear axis. In Supplementary Figure 2, we quantified differences in distribution and coefficient of variation in these measurements, showing that Trpv1 had significantly higher coefficient of variation than either Oprm1 or Oprd1.
Figure 4
Figure 4
Co-expression patterns of nociceptive ion channels and opioid receptors. To assess the overlap between nociceptive transducing ion channels and opioid receptors, multiplex fluorescent hybridization was performed for Trpv1, Trpa1, Oprm1 and Oprl1. This analysis was performed in N = 3 rats total, and 805 cells. (A) Counts were tabulated for co-expression of these four markers in each cell, and the intersections of these are plotted. The most prevalent count group was Oprl1 alone, due to the near-ubiquitous nature of this marker (272 cells). Cells positive for all four labels (133 cells) were also prevalent, indicating overlap between nociceptive ion channels (Trpv1 and Trpa1) and the mu-opioid receptor Oprm1 as well as Oprl1. Populations containing Trpv1 and Oprm1 with or without Oprl1 (59 cells with all three and 147 cells with Trpv1/Oprm1 only) were also prevalent, reinforcing the overlap between these two markers. (B) A representative panel showing a diverse field of cells is shown, with quad-positive neurons highlighted (arrows). Additionally, Trpv1+/Oprm1+ cells are indicated (arrowheads). (C–F) To increase the visibility of the highly multiplexed image, individual channels and channel pairs are shown for the image in (B), with the channel identity found in the bottom right of each panel. (C) A panel showing only Trpv1 and Trpa1 was selected to show the relationship between these two nociceptive ion channels. (D) A range of intensities was observed for Oprm1. Note the presence of less prominent puncta in Trpv1+/Oprm1+ cells (arrowheads). (E) Oprl1 alone. (F) Oprm1 and Oprl1. Scale bar applies to all images.
Figure 5
Figure 5
Quantification of nociceptive ion channel and opioid receptors. We further examined the subpopulations of DRG neurons shown in Figure 3. (A) Enlarged and enhanced fields were shown for each of three representative cell populations corresponding to high, medium and low Trpv1 expression. Note that several populations of cells have medium Trpv1 expression, but that one of the most common subtypes (Trpv1 and Oprm1 alone), was selected. Similarly, a quad-positive neuron was selected as representative of low Trpv1 expression. (B) To examine the relationship between Trpv1 and Trpa1 in particular, expression levels in perikarya of cells expressing either marker were examined in further detail. In this representative field, neurons strongly enriched for Trpv1 (arrowheads) or Trpa1 (arrow) are indicated, as well as two neurons (asterisks) that co-express these two ion channel genes. (C) Using cell counting, we identified the coincidence of these two markers. More cells express Trpv1 than Trpa1 with the majority of Trpa1+ cells co-expressing Trpv1, and only 10 Trpa1+ cells expressing no detectable Trpv1. (D) However, cells expressing high levels of either Trpv1 or Trpa1 express very low levels of the other transcript. Therefore, the expression of these two markers while coincident, appears to be anticorrelated (note that points fall on the axes rather than in the middle of the plot. (E) Pairwise coincidence is shown for each of the four labels in this experiment. All of these combinations are common (with the rarest being approximately 19.1% of all cells). High Trpv1 neurons, in particular, seemed to differ from other Trpv1 neurons in terms of Oprm1 expression. (F) We addressed this by counting high Trpv1 neurons separately from other Trpv1 neurons (shown in pie charts). Whereas average Trpv1 neurons expressed Oprm1 the majority of the time (85.7%), the high Trpv1 neurons expressed Oprm1 only 18.1% of the time. On average, the expression in these cells was also lower (Supplementary Figure 3). Outlines (dotted lines) of neuronal perikarya are shown to enhance visbility.
Figure 6
Figure 6
Characterization of Trpm8 expression levels in rat DRG. To assess the overlap between hot and cold thermal nociceptive transducing ion channels, multiplex fluorescent hybridization was performed for Trpv1, and Trpm8 alongside Oprm1. (A) Panoramic view of triple-labeled rat DRG. (B) Cells positive for Trpm8 were brightly labeled small diameter neurons (white arrows). However, a number of other neurons were also visible with lower levels of Trpm8. (C) Similar to what was performed for Trpv1, enhancement of the image saturates the high-expressing Trpm8 neurons, but allows for visualization of the much lower intensity staining observed in other neurons. Note that these neurons still have clear punctate staining pattern and that this staining pattern was reproduced with a different probe for confirmation (Supplementary Figure 4). (D) Another characteristic of Trpm8 neurons is that 100% of them co-express Oprm1 to some extent. This relationship is visualized in the representative field. (E) A surface plot of Trpm8 expression levels is shown with arrows pointing to the highest expressing Trpm8+ neurons. Note the lower peaks span a range of expression levels. (F) The relationship between Trpv1 and Trpm8 was further explored by quantifying levels of expression of these two thermal transducing ion channels shown in the representative field. (G) The Trpv1+ population was much larger than the Trpm8+ population, and approximately half of Trpm8+ neurons co-expressed Trpv1. (H) However, with quantification we saw that no cell co-expressed these markers strongly, and that their expression was anticorrelated (note that the points fall on the axes rather than in the center of the plot).
Figure 7
Figure 7
Co-expression analysis for Trpv1, Trpm8, Oprm1, and Scn11a. To further assess the overlap between nociceptive transducing ion channels and opioid receptors, multiplex fluorescent hybridization was performed for Trpv1, Trpm8, Oprm1 and Scn11a in N = 3 rats (n = 570 cells). In this experiment, we investigated the mRNA coding for the cold-pain transducing nociceptive ion channel Trpm8 as well as the mRNA encoding the voltage-gated ion channel subunit Scn11a. (A) Counts were tabulated for co-expression of these four markers as before. The most prevalent group were neurons co-positive for Trpv1, Oprm1 and Scn11a (197 cells). Notably, a large number of neurons was also unlabeled (167 cells). Arrows in the plot in (A) are used to identify cells in the representative fields in subsequent panels. High Trpv1 neurons (arrows) are not in the plot in (A), but were highlighted in the representative fields. (B) A panoramic stitched image is shown to demonstrate the anatomical location of these markers within the greater structure. In the center of the field, a representative area was enlarged for subsequent panels. (C) Overlay of the 4-plex label with DAPI and brightfield is shown. Note that examples of the most prevalent cell type, Trpv1+/Oprm1+/Scn11a+ neurons are indicated (arrowheads). Larger diameter cells with no reactivity for these markers are indicated (asterisks). A singular putative thermosensing c-fiber is indicated with very high levels of Trpv1 (arrow). (D). Note the varying levels of Oprm1 in Trpv1+/Oprm1+/Scn11a+ neurons (arrowheads), and absence of Oprm1 in the high-expressing Trpv1+ neuron (arrow). (E) In an overlay of Trpv1 and Trpm8, note that cells were generally high in one or the other but not both markers. (F) Also note the sparse labeling of Trpm8, indicative of its specialized function. (G) The sodium channel subunit Scn11a was prevalent in Trpv1+/Oprm1+/Scn11a+ neurons (arrowheads), as well as strongly expressed in many cells throughout the ganglion. Scale bar applies to all images. Scale bar applies to (C–G).
Figure 8
Figure 8
Co-expression of the nociceptive and analgesic markers Trpv1, Oprm1, and Oprl1 with Secreted Phosphoprotein 1/Osteopontin (Spp1) transcript. Co-expression of Trpv1, Oprm1, and Oprl1 with Spp1, a marker of DRG neurons thought to be chiefly implicated in proprioception. (A) In a co-expression plot, all of the Spp1+ neurons co-expressed Oprl1, while none showed expression of Trpv1 or Oprm1 (83 Spp1+/Oprl1+ neurons, red arrow). (B) A panoramic view of a whole rat DRG stained for this combination of markers. Note the distinct signal for Spp1. (C) An enlargement of a different DRG neuron shows spatially distinct areas with and without Spp1 neurons. (D) Note that Spp1+ neurons (arrows) do not contain any Trpv1 or Oprm1 signal.
Figure 9
Figure 9
Summary of identified cell types with size analysis. For each of the major identified cell types in the present study, a representative image (66 μm square) is shown. Additionally, histogram information of the cell size for each population is identified in ascending order of mean size ± SEM. High Trpv1 neurons were the smallest cells (20.1 μm ± 0.4). Oprm1+/Oprd1+ neurons were the largest cells identified, with an average size of 44.0 μm ± 0.9. Scale bar applies to all images. These analyses were performed with at least N = 3 rats.

Similar articles

Cited by

References

    1. Akopian A. N., Sivilotti L., Wood J. N. (1996). A tetrodotoxin-resistant voltage-gated sodium channel expressed by sensory neurons. Nature 379, 257–262. 10.1038/379257a0 - DOI - PubMed
    1. Akopian A. (2011). Regulation of nociceptive transmission at the periphery via TRPA1-TRPV1 interactions. Curr. Pharm. Biotechnol. 12, 89–94. 10.2174/138920111793937952 - DOI - PubMed
    1. Anderson E. M., Jenkins A. C., Caudle R. M., Neubert J. K. (2014). The effects of a co-application of menthol and capsaicin on nociceptive behaviors of the rat on the operant orofacial pain assessment device. PLoS ONE 9, e89137. 10.1371/journal.pone.0089137 - DOI - PMC - PubMed
    1. Bardoni R., Tawfik V. L., Wang D., Francois A., Solorzano C., Shuster S. A., et al. . (2014). Delta opioid receptors presynaptically regulate cutaneous mechanosensory neuron input to the spinal cord dorsal horn. Neuron 81, 1312–1327. 10.1016/j.neuron.2014.01.044 - DOI - PMC - PubMed
    1. Bautista D. M., Siemens J., Glazer J. M., Tsuruda P. R., Basbaum A. I., Stucky C. L., et al. . (2007). The menthol receptor TRPM8 is the principal detector of environmental cold. Nature 448, 204–208. 10.1038/nature05910 - DOI - PubMed